 Pictures of the Mandelbrot set, such as the one to the left, are pretty to look at, and fascinating when you zoom in to see more detail.
But the origin of the design often isn't made clear. In this post, I'm going to slowly step through each important detail in way that helps you understand it.
Recently, Numberphile posted a video about the Mandelbrot set, as explained by Dr. Holly Krieger of MIT:
Even this video tends to gloss over some points, so my explanation will be somewhat slower, and build up differently.
THE BASICS
Let's start with something very familiar, the number line you probably grew up seeing in your elementary classroom every day.

We're also going to start with a very simple formula: z2 + c. The variable c will act as a chosen starting point, and we'll be putting different numbers in the formula, except that c will remain constant (c is for constant).
What about that z2, though? That, of course, represents z multiplied by itself, and we'll be changing the value of z. Where do we start? As in the video, the starting point for z will always be 0. The next value for z, though, is whatever we get out of the equation from the previous calculation.
One of the simplest starting point is 1, so let's demonstrate with that. Since we chose 1, the formula becomes z2 + 1. Using 0 for our initial value of z, we have 02 + 1 = 0 + 1 = 1. If we take this 1 and use it as our new value of z, and keep using the previous result for our new value of z, we get the following values:
- 12 + 1 = 1 + 1 = 2
- 22 + 1 = 4 + 1 = 5
- 52 + 1 = 25 + 1 = 26
- 262 + 1 = 676 + 1 = 677
Each of these repeated calculations is referred to as an iteration of the formula. Perhaps not surprisingly, these numbers get bigger quickly after only a few iterations. We can have Wolfram|Alpha run through the z2 + 1 formula for us. Click on the More button in the Values pod will show that after only 9 iterations, the number is already up to about 1.94727 × 1045 (roughly 2 followed by 45 zeroes)!
NOT EVERY NUMBER GETS BIGGER
What's the big deal? Doesn't every number get bigger? No, not all of them do. One of the more interesting numbers that doesn't get bigger is -2. If we run z2 + (-2) through a few iterations, it quickly reaches a result of +2 and never gets any bigger!
If we use a number that's even slightly smaller than -2, such as -2.000001, we can see that such numbers will continue to grow. That's why the 2 cases in the video are defined as Case One: Blows Up and Case Two: Stays Small (<= 2), and why 2 is considered a special value in the Mandelbrot set.
Now, in the video, Dr. Krieger mentions that 1⁄4 is on the boundary, so what happens with that number itself? Not only does 1⁄4 NOT surpass 2, it never even reaches 0.5!
So, what we have so far is just a line from 2 to about 1⁄4. Why about? Well, 1⁄4 isn't as solid a border as -2. For example, we can move a tiny bit to the right on the number line, say to 100001⁄400000, and we find that point never exceeds 2. That point is too small to accurate mark on the number line, as compared to the next handy fraction, such as 1⁄3, which eventually does grow past 2.
INTO TWO DIMENSIONS
Let's finally get off the number line and jump into 2 dimensions. We could attempt to use standard graph paper-style Cartesian coordinates of the form (a, b), but the mathematics required to handle 2 separate coordinates quickly complicates the formula.
This is why the imaginary number plane and complex numbers come into the picture. Read BetterExplained.com's A Visual, Intuitive Guide to Imaginary Numbers to get a good grasp of how these work. If those interest you, you may want to read Intuitive Arithmetic With Complex Numbers and Understanding Why Complex Multiplication Works at the same website.
For c, let's try the complex set of coordinates 0.5 + 0.5i. Running those coordinates through Wolfram|Alpha we see that after only 14 iterations, the results become roughly (-6×10287) + (-4×10287i)!
Thanks to the effects of i, the results can obviously get into negative numbers quickly, and the answers get confusing. What we need to do, then, is translate each result into polar coordinates. We're not so much worried about θ (the angle), but rather r (the radius), which is measured as the distance from the origin point. The radius is always a positive number, and we can simply judge whether this is bigger than 2.
Converting (-6×10287) + (-4×10287i) to polar coordinates, we get a radius of roughly 7.2111×10287 units from the center, so these coordinate definitely escape 2!
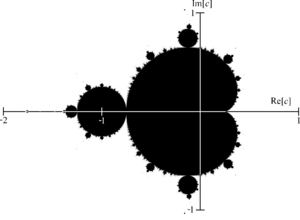
To cover two dimensions, we need to focus on a particular range. In the video, Dr. Krieger talks about using a radius of 2 units in all directions, but most of the Mandelbrot pictures you see tend to use a range of -2 to +1 on the real number line, and i to -i on the imaginary plane.
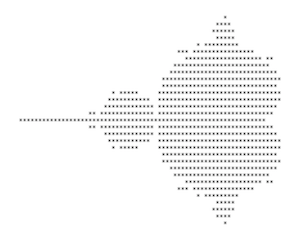
Besides a range, we also need to choose a “resolution.” To keep things simple, we might choose a resolution such as 70×30. So, we'd break up the space from -2 to +1 into 70 equally-spaced coordinates horizontally, and we'd break up the space from i to -i into 30 equally-spaced coordinates vertically.
Then, for each of those 2100 (70 × 30) coordinate pairs, we'd put them in complex coordinate form (a + bi), and assign that to c. We'd run through z2 + c for that set of coordinates and see if the radius ever became larger than 2 (in other words, whether there's a limit to the iterations). If so, we would assign a white square to it. If not, we would assign a black square to it (or an asterisk, if we're working in ascii).
Mapping those results gives you an image that appears as follows (click the image to see a larger version):

This picture is the result of 2100 calculations, with each calculation being iterated to varying degrees. Is it any wonder than the Mandelbrot set couldn't have been discovered until computers became commonplace?
Now things are starting to look much more familiar! For a better picture, just as you would with any display, you increase the resolution. Given 300×220 as the resolution, you would get an even clearer picture (click the image to see a larger version):

PLAYING WITH THE RESULTS
Those simple black and white versions only show which sets of complex coordinates, when iterated through z2 + c, fall into which of the 2 cases. The pictures you usually see are much more colorful. What is the deal with those pictures?
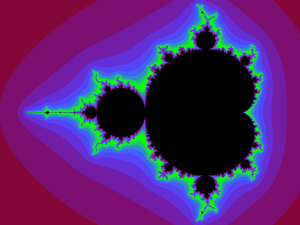
Instead of asking just a yes-or-no question (Does the radius of the iteration ever exceed 2?), we change the question to “How long before the radius of the iteration exceeds 2?” If the radius of the iteration never exceeds 2, we use black. If the radius of the iteration exceeds 2 after 1 iteration, we'll use a color we'll call color 1, after 2 iterations we use a 2nd color, after 3 iterations we use a 3rd color, and so on.
That approach, known as the escape time algorithm, gives us the standard Mandelbrot set images with which you are likely familiar (click the image to see a larger version):

Notice that you even get better contrast with this version, as you can see “branches” that aren't easily seen in the black-and-white versions.
As an aside, that name, escape time algorithm, brings up a good point. In the Numberphile video above, they make it sound as if distance is important. Instead, it's actually the amount of iterations it takes a number to escape the value of 2. The Mandelbrot isn't a measurement of distance, but rather time.
The colors chosen are usually a matter of personal preference, which is why you see so many different variations. If you don't like the banding effect of sudden color changes, there are even ways to smooth that out.
Remember how it's impossible to tell when moving the tiniest amount to the right of 1⁄4 on the number line would result in a set of iterations whose radius would ever exceed 2? Thanks to computers, we can choose a smaller range, an appropriate resolution, and zoom in to study the complexity of that particular area (known to Mandelbrot set fans as “Elephant Valley”):
Consider that all these results have been coming from iterating the same equation, z2 + c. What happens if we try taking z to another power, such as z3 + c or z4 + c? Here's what happens when changing those powers from 2 to 5:

Once you understand the basics, there's plenty of ways to explore the amazing world of fractals such as these. I've written on fractals several times on Grey Matters, including Iteration, Feedback, and Change: Fractals, R.I.P. Benoît Mandelbrot (November 20, 1924 - October 14, 2010), and A Closer Look, so you can explore further if you wish.


No Response to "Mandelbrot Set: What Exactly Are We Looking At, Anyway?"
Post a Comment