
 When the microscope and the telescope were invented, the world changed radically. Humanity saw, for the first time, things they didn't expect to see, and realized the world was weirder than they expected.
In this post, I'm going to take a closer look at what happens when you take a closer look.
Let's start with a simple example. How far is it from Las Vegas, Nevada to Birmingham, Alabama? Thanks to the internet, we can find this out from Wolfram|Alpha: 1,622 miles. It's always a good idea to verify your answers. We ask Google Maps, and see that the answer is...1,818 miles?!? That's almost 200 miles difference!
The discrepancy, of course, is due to the fact that Wolfram|Alpha measured the distance as a straight line, while Google Maps must restrict itself to its knowledge of existing roads. Google Maps' route is longer because it is taking more detail into account. If you set your car's trip odometer to measure the distance, you'd find it's even longer. Why? Because the car's trip odometer will reflect the added distance involved in finding rest stops, restaurants, shopping, and motels, as well. Once again, more detail added provides a more exact distance.
Back in the 1940s, a scientist named Lewis Fry Richardson ran into this same idea, while researching the relationship of two country's shared border length to their likelihood of going to war. When researching border lengths, though, he found that they were quoted with wildly varying lengths. The Netherlands/Belgium border, for example, was quoted in once source as being 380 kilometers (km) long in one source, and 449 km long in another. Similarly, the Spain/Portugal border was quoted as being anywhere from 987 to 1214 km long.
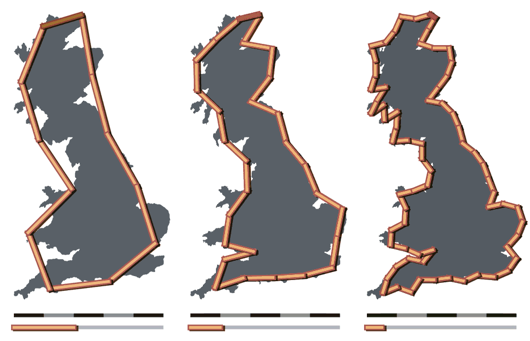
Richardson was, of course, familiar with the principle from the Las Vegas/Birmingham example above, and realized that this was partially responsible. He found that if you were to measure the coast of Britain with a 200 km ruler, with the stipulation that both ends of the ruler had to touch the coast, you would get one length. However, if you measured the coast of Britain in the same way with a 100 km ruler, the result would be longer. Measure the coastline of Britain again in the same way with a 50 km ruler, and the answer would be longer still, as shown in the image below.
When Richardson first observed this, his first impression is that the various lengths would simply get closer and closer to some number, which would be the idealized length of the coastline. This is a common concept in mathematics. For example, this image shows that 1/4 + 1/16 + 1/64 and so on into infinity will simply get closer and closer to a limit of 1/3. However, upon further examination, Richardson discovered that the coastline length simply got longer and longer, with no discernible limit!
Richardson published a paper on this, and this tendency is known to this day as the Richardson effect, but the paper itself was largely ignored. It gained new prominence, however, when Benoit Mandelbrot wrote How Long Is the Coast of Britain?.
If Benoit Mandelbrot's name seems familiar, it's because of his groundbreaking work in fractals, where this post is heading. If you're not familiar with the basics of fractals, check out my post Iteration, Feedback, and Change: Fractals, and watch the Hunting the Hidden Dimension documentary. We'll be discussing logarithms, and if you're not familiar with them, you can quickly get up to speed by watching the Simple introduction to Logarithms video and reading BetterExplained's Using Logarithms in the Real World.
Mandelbrot's wrote more about the importance and uses of a fractional dimension, also known as a fractal dimension (as Mandelbrot would later call it) or a Hausdorff dimension (after the mathematician who first presented the idea in 1918). Confused? Think of dimensions as you ordinarily think of them. A line has only length (1 dimension), a rectangle has length and width (2 dimensions), and a box has length, width, and depth (3 dimensions). What Mandelbrot brought to the problem was the consideration of dimensions between the whole numbers.
What exactly does this mean? The following video explains it briefly and clearly:
It can be challenging to think of this as a dimension in the way most people are used to that term. It boils down to being a ratio that's simply stating how much more detail can you expect for any given scaling factor. In the Sierpinski triangle example above, the detail will increase by a factor of 1.5849 (approximately) unit for every unit you scale the image. Put in an overly-simplified way, think of the number as an indicator of how much more “stuff” you can expect to be revealed when you zoom in on the image.
You can find a list of patterned fractals and their respective dimensions here. The approach used above is easy enough to understand when you're using a pre-determined pattern, but what about the problem of the coastline of Britain? That's a naturally-created shape, so you might think it would be challenging to analyze it.
If you recall that we're comparing level of detail to level of scaling, however, then the process of calculating them is just that: comparing scale to detail. Here's a video explaining the process:
The generalized formula for a fractal dimension, then, is D = log(N)/log(1/r), where N is the ratio of detail, and r is the ratio of the measurement scales. You might think a mistake is made in the above video, since 4 inches gave us 8 steps and .5 inches gave us 110 steps, shouldn't the formula be log(110/8)/log(.5/4)? Note the 1 in the log(1/r) - it effectively flips the bottom ratio, and gives us a positive dimension instead of a negative one.
The work in the video was a quick-and-dirty measurement, resulting in log(110/8)/log(4/.5) = 1.26. This is actually pretty close to the actual answer of 1.25, as measured in Lewis Fry Richardson's original paper.
Mandelbrot's original British coastline paper is a little complex to read, as the application of the fractal dimension isn't a matter of a straightforward multiplication. However, there's a very accessible discussion, including more resources, about the British coastline paradox over at Ask Dr. Math.
I suppose I could pursue this further, but this is all the detail I'm showing at this level.
0
A Closer Look
Published on Sunday, March 18, 2012 in math, self improvement, videos
Spread The Love, Share Our Article
Subscribe to:
Post Comments (Atom)


No Response to "A Closer Look"
Post a Comment