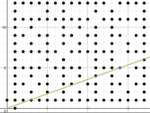
 Since writing my previous post, I've been having more fun with Desmos.
For today's post, I though we'd use it to take a field trip of sorts, through a mathematical orchard, planted on a grid.
If you've ever driven by one of those groves or orchards where all the plants are evenly spaced, you'll have an idea of the type of layout that we're going to use.
Think of a 20 by 20 grid on graph paper, and you're standing at the southwest corner of the grid, at what would be marked as (0,0). On every grid point marked by two non-negative integers (whole numbers equal to 0 or more), except for (0,0) of course, there are very thin and tall sticks, all of which are exactly the same size and shape. So, there are sticks at (0,1), (1,1), (2,1), and so on.
This is the field we'll explore in this post.
CAN YOU SEE EVERY STICK?
Imagine standing at (0,0), and facing directly north. You would naturally see the stick at (0,1). It's not hard to understand that you couldn't see the sticks directly behind it when looking straight at the first stick.
Sure, in the real world you could lean a bit to one side or the other to see them, but in our field trip on this grid, we're going to look at things as if you're always standing straight and looking directly ahead. Don't worry, I'm done sound like your parents.
With these assumptions under our belt, it's easy to understand that you wouldn't be able to see every stick. The question then becomes, which grid points are visible from (0,0), and which ones aren't?
HIDDEN STICKS: IS THERE A PATTERN?
This is where Desmos comes in. I've set up a 20 by 20 grid here (also known as an integer lattice) and a 10 by 10 integer lattice here (works better on mobile devices. You'll probably want to click on the options menu in the upper right and turn Projector Mode on.
All the integer grid points have sticks, but the dots on the grid show only the sticks that are visible from (0,0). Note the instructions in the upper left, which explains the meaning of the sliders and the red and blue dots.
Looking at the grid, it's easy to see why, say, (0,2), (2,0), and (2,2) are obscured, but is there any pattern to which sticks are hidden, and which ones aren't?
Let's examine a more obscure spot. Examine the point (6,9) by moving the a slider to 6 and the b slider to 9. You should see a blue dot at (6,9), and note that the red dot blocking it is located at (2,3).
Hmmm...if you take the 2 from (2,3), and multiply by 3, you get the 6 from (6,9). If you multiply the 3 from (2,3) by 3, you get the 9 from (6,9). Could this be a pattern?
Let's try looking at (4,10), and sure, enough, it's marked with a blue dot, blocked by a red dot at (2,5)! If you divide both 4 and 10 by 2, you get 2 and 5 respectively. This will probably remind you of your days in school when you learned about reducing fractions.
Any time you set a pair of coordinates, and the two numbers have a factor of 2 or more in common, you'll find that the dowel at that point will be blocked. If you reduce the coordinates in the same way you'd reduce a fraction, you'll find a red dot at that coordinate pair, because it's blocking your view of the blue dot.
As a matter of fact, we can turn the coordinates into a very important fraction, the fraction that represents the slope of the line! Here's a quick refresher course on how to work out the slope of any line:
0
Math Out in the Field (Part 1)
Published on Sunday, December 02, 2012 in fun, math, software, videos
Related Posts
Subscribe to:
Post Comments (Atom)


No Response to "Math Out in the Field (Part 1)"
Post a Comment