 As regular readers of Grey Matters know, I love free online mathematical tools, such as Wolfram|Alpha and instacalc.
There's a new one to add to the mix; it's an online graphing calculator called Desmos. Once you grasp the basics, it's very fun and easy to use.
Below is the introductory video to Desmos made last year:
Much like Wolfram|Alpha, Desmos keeps updating and improving. This second video gives you an idea of the new look and added features you'll see at this writing:
Desmos has made it easy to learn to use, with the help of a 9-page PDF manual, a FAQ section, and a wide variety of videos, including some great How-To videos.
To see some of Desmos' features, let's start with a simple static plot. Here's a function that plots a heart shape. Click on or touch the options button in the upper right, and try clicking the Projector Mode button on and off. If you find your plots are too faint to print or show up on a projected screen, you can use this to make the lines thicker and more visible. Click or touch the options button once again to hide the options menu.
For comparison, here's the same heart-shaped function as plotted in Wolfram|Alpha. Note that Wolfram|Alpha, being made for more advanced calculations, also plots the imaginary part of the graph. Since we just want the real part, we can modify it with the Re[] command. From the lines going off from each side of the heart shape, you can see that Wolfram|Alpha's version is slightly more precise, as well.
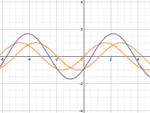
For an even more startling comparison, however, let's try plotting some sine waves. Sine wave #1 will simply be the basic formula, y=sin(x). Sine wave #2 will be the same size and shape, just moved over by a units on the grid, so the formula is simply y=sin(x + a). The third and final sine wave will consist of these two sine wave added together, much like when two water waves meet and boost each each other or cancel each other out, so the formula would simply be y=sin(x)+sin(x+a).
For an example, we'll start with a=-1.17, so the second sine wave will be the same size and shape as the first, but it will be moved to the left (denoted by the minus) by 1.17 units on the grid.
If we try this example with Wolfram|Alpha, here's the results you get. If you want to change a, you could either manually change the -1.17 values in the two formulas and recalculate. Trying this with several different values can get tedious, however. Alternatively, you could pay for Wolfram|Alpha PRO, and then use the enable interactivity button.
Now let's try the same setup on Desmos. Here, there's a slider you can change by either dragging it with your mouse, or touching different points along the line on your mobile device. As you change the value of the slider, the wave changes, and you instantly get a visual idea of how the three waves relate to each other! This demo gives you a good idea of the potential power of Desmos.
One of the main reasons I'm so enthusiastic about Desmos is its potential for clarity and understanding of mathematical concepts. The first time I ever really understood sine and cosine was watching Project Mathematics' Sine and Cosine video series, which used a similarly visual approach. Part 1 is below (Part 2 is here and Part 3 is here):
Ever since seeing that 20+ years ago, I always wanted to have a computer program to play around with graphical concepts in the same way that's done in the video, especially if it had the same apparent ease of use. Desmos comes closer to that idea than anything else I've come across. The fact that it's freely available online is icing on the cake!
1
Desmos Graphing Calculator
Published on Thursday, November 29, 2012 in fun, math, self improvement, software, videos
Related Posts
Post Details
Subscribe to:
Post Comments (Atom)


1 Response to Desmos Graphing Calculator
Thanks for the kind words, Pi Guy! Happy that your 20 year wait is finally over :)
We have some exciting upgrades coming out in just a few weeks - can't wait to share them with you. Stay tuned!
-Team Desmos
Post a Comment