0

Free iOS Memory Training Apps

Published on Sunday, March 25, 2012 in , , , , ,

Dominic Alves' iphone calculator photoMany people who are interested in improving their memory think they have neither the time nor money to spend on doing it.

With some help from your iOS mobile device, and the free apps listed here, you can start improving your memory right away!

I can't, of course, guarantee that any or all of these app will remain free. That is up to their respective developers. However, as of the date of this post, each of these apps has remained free for at least 2 full weeks, which is much longer than the average temporary free discount.

All app links in this post (in bold) will take you directly to the corresponding app's iTunes store page. Please double check for yourself that a given app is still free at the time you download it, as I cannot accept any responsibility for charges made to your account, accidentally or otherwise.

The apps are divided into 4 categories:

Basic Techniques
Flashcards
Memorize Speeches/Poems/Lyrics
Memorize Specific Topics

Basic Techniques

Dave Farrow Memory Training - The most basic technique to learn is called linking. This app teaches it clearly, and even helps provide visual examples of the technique.

NumberThink - Even when you've mastered linking, numbers can still prove a challenge. This app teaches one of the standard methods for turning numbers into easily-pictured images, which can then be used with the linking technique. Once you're comfortable with this techniques, you can also practice using it with number lists generated by the free iOS apps Build Brain Power and/or Mnemometer.

Memgellan - There's another technique that's been gaining popularity ever since the release of the book Moonwalking With Einstein. It's called the Journey Technique, since it uses steps on a familiar journey as places to keep reminders. You can group your places and photos together in journeys in this app, which really helps to make the technique work more vividly.

How to memorize a deck of cards - This app expands on the journey system with the other system mentioned in Moonwalking With Einstein, called the PAO system. This app specifically uses the technique to help you memorize shuffled decks of cards, but you'll find the technique is adaptable to other feats, as well.

Namerick - Find it hard to remember names and connect them to faces? Namerick helps solve this problem by having you enter the name you want to remember, along with a note about the person (are they a relative, friend, salesperson, etc?), and then makes up a funny phrase to help you remember that name. Using the notification abilities of iOS, it also quizzes you at regular intervals to make sure the memory stays fresh in your mind!

Flashcards

SuperMemo - This flashcard program has been around a long time. Back in the days of the Palm Pilot, I had SuperMemo on it, as well. This was the first flashcard program to popularize the Leitner system, also known as spaced repetition, so that you're quizzed on material with which you have more difficulty. To this day, other flashcard programs of this type even advertise themselves as using the SuperMemo algorithm!

There are a number of other Flashcard tests with similar capabilities, including gFlash+ Flashcards & Tests, FlashCardQ3 (with Dropbox capabilities!), Flashcards+, and A+ FlashCards Pro.

Memorize Speeches/Poems/Lyrics

memoRISE - memoRISE lets you store whatever texts you want to remember, and then helps you memorize it either by removing random words, or showing you only the first letters.

P2R - P2R only uses the missing word method of testing your memory, but adds some other nice features, including account management, notes on each text, printing options, and the ability to export your text and notes.

iMemorize Mobile/iMemorize for iPad - iMemorize also employs the missing word method, and stores your texts, but also allows you to organize your texts into categories. For example, you can keep your poems in one category, your speeches in another category, and your lyrics in yet another category.

Memorize Specific Topics

BrainNmonX/Brain Mnemonics 2 (Note: Double check the price of Brain Mnemonics 2 here) - As long as you're stretching your brain, why not learn more about the brain itself? These two programs teach some amazing and fun mnemonics to help you remember the parts and functions of the brain. You can also reinforce these lessons with help from episode 72 of the author's podcast, Psych Files, which is also available on YouTube (Part 1, Part 2).

Memorize e - e is another one of those fundamental mathematical constants that has and endless amount of digits, like Pi. Also like Pi, there's no reason to memorize it, except for the personal challenge aspect of it. This program can help you do just that by teaching you how to memorize it, and then challenging you to see how many digits in a row you can correctly enter. If you're curious about what e is, I recommend reading BetterExplained's An Intuitive Guide To Exponential Functions & e.

Bob Burtons Speed Cubing - If you've ever wanted to learn how to solve the Rubik's Cube for speed, this is definitely the app for you! Even if you already solve the cube, this app will help you get faster by teaching you the Jessica Fridrich method for speed cubing.

If you have any recommendations for free memory apps, let's hear about them in the comments!

0

Tessellations

Published on Thursday, March 22, 2012 in ,

Fibonacci's Demiregular tiling with trianglesIn the last post, the topic was the complex shapes known as fractals. For this post, we'll simplify things by dealing with nice, simple repeating shapes.

Patterns that repeat without leaving any gaps or overlapping areas are known as tessellations, and they're a great way to mix fun and creativity with math.

Let's start with the basics and some inspiration, with help from Square One TV:


It's easy to see how many perfect geometric shapes can be repeated, so this can seem somewhat restricting. It seems to be a nice technique if you, say, want to create a honeycomb pattern, but what else can you really do with it?

If you're familiar with the works of M. C. Escher, you'll recall he did a great deal of work with tessellations. Most impressively, his shapes weren't simple and flat, but interesting shapes such as horses, riders, angels, demons, fish, and many more!

The video below will show you how to start with simple triangles, and get you started on creating your own wildly-tessellating creations:


One of the tessellating shapes Escher is best remembered for is his lizard patterns. It's so recognizable, yet somehow still repeats in a surprising way.

It's hard enough to solve a jigsaw puzzle with a tessellating pattern, but at least you have the different shapes of the pieces to help you. What if the shapes of the pieces themselves were those tessellating lizards, and thus were all the same shape? At least with that online version, you still have flat sides, so you can at least start with the edges. The makers of the Shmuzzle Puzzles take away that advantage by making every piece an identical shape!

When you play with tessellations enough, you'll realize that you start to see the same base shapes used as starting points. While it's obvious you can't use just any shapes, you may be surprised to learn that not all regular geometric shapes are suited to these repeating patterns. Most notably, the humble pentagon doesn't tessellate on it's own.


The main problem the pentagon has is that each of its internal angles is 108°, which doesn't divide evenly into 360°. Of course, just because a shape can't tessellate on it's own, doesn't mean you can't find other shapes that will work with it. To learn more about how mathematicians learned to tame the pentagon, read Craig Kaplan's article, The trouble with five.

I can only begin to give you a taste of the fun you can have with tessellations in this post. To explore even further, check out tessellations.org. My favorite there is the their chess set designs. Look around that site, and you may be surprised at what you find enjoyable and inspiring.

0

A Closer Look

Published on Sunday, March 18, 2012 in , ,

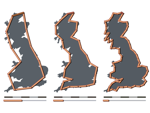
Avsa's and Acadac's British coastline measurement graphicsWhen the microscope and the telescope were invented, the world changed radically. Humanity saw, for the first time, things they didn't expect to see, and realized the world was weirder than they expected.

In this post, I'm going to take a closer look at what happens when you take a closer look.

Let's start with a simple example. How far is it from Las Vegas, Nevada to Birmingham, Alabama? Thanks to the internet, we can find this out from Wolfram|Alpha: 1,622 miles. It's always a good idea to verify your answers. We ask Google Maps, and see that the answer is...1,818 miles?!? That's almost 200 miles difference!

The discrepancy, of course, is due to the fact that Wolfram|Alpha measured the distance as a straight line, while Google Maps must restrict itself to its knowledge of existing roads. Google Maps' route is longer because it is taking more detail into account. If you set your car's trip odometer to measure the distance, you'd find it's even longer. Why? Because the car's trip odometer will reflect the added distance involved in finding rest stops, restaurants, shopping, and motels, as well. Once again, more detail added provides a more exact distance.

Back in the 1940s, a scientist named Lewis Fry Richardson ran into this same idea, while researching the relationship of two country's shared border length to their likelihood of going to war. When researching border lengths, though, he found that they were quoted with wildly varying lengths. The Netherlands/Belgium border, for example, was quoted in once source as being 380 kilometers (km) long in one source, and 449 km long in another. Similarly, the Spain/Portugal border was quoted as being anywhere from 987 to 1214 km long.

Richardson was, of course, familiar with the principle from the Las Vegas/Birmingham example above, and realized that this was partially responsible. He found that if you were to measure the coast of Britain with a 200 km ruler, with the stipulation that both ends of the ruler had to touch the coast, you would get one length. However, if you measured the coast of Britain in the same way with a 100 km ruler, the result would be longer. Measure the coastline of Britain again in the same way with a 50 km ruler, and the answer would be longer still, as shown in the image below.


When Richardson first observed this, his first impression is that the various lengths would simply get closer and closer to some number, which would be the idealized length of the coastline. This is a common concept in mathematics. For example, this image shows that 1/4 + 1/16 + 1/64 and so on into infinity will simply get closer and closer to a limit of 1/3. However, upon further examination, Richardson discovered that the coastline length simply got longer and longer, with no discernible limit!

Richardson published a paper on this, and this tendency is known to this day as the Richardson effect, but the paper itself was largely ignored. It gained new prominence, however, when Benoit Mandelbrot wrote How Long Is the Coast of Britain?.

If Benoit Mandelbrot's name seems familiar, it's because of his groundbreaking work in fractals, where this post is heading. If you're not familiar with the basics of fractals, check out my post Iteration, Feedback, and Change: Fractals, and watch the Hunting the Hidden Dimension documentary. We'll be discussing logarithms, and if you're not familiar with them, you can quickly get up to speed by watching the Simple introduction to Logarithms video and reading BetterExplained's Using Logarithms in the Real World.

Mandelbrot's wrote more about the importance and uses of a fractional dimension, also known as a fractal dimension (as Mandelbrot would later call it) or a Hausdorff dimension (after the mathematician who first presented the idea in 1918). Confused? Think of dimensions as you ordinarily think of them. A line has only length (1 dimension), a rectangle has length and width (2 dimensions), and a box has length, width, and depth (3 dimensions). What Mandelbrot brought to the problem was the consideration of dimensions between the whole numbers.

What exactly does this mean? The following video explains it briefly and clearly:


It can be challenging to think of this as a dimension in the way most people are used to that term. It boils down to being a ratio that's simply stating how much more detail can you expect for any given scaling factor. In the Sierpinski triangle example above, the detail will increase by a factor of 1.5849 (approximately) unit for every unit you scale the image. Put in an overly-simplified way, think of the number as an indicator of how much more “stuff” you can expect to be revealed when you zoom in on the image.

You can find a list of patterned fractals and their respective dimensions here. The approach used above is easy enough to understand when you're using a pre-determined pattern, but what about the problem of the coastline of Britain? That's a naturally-created shape, so you might think it would be challenging to analyze it.

If you recall that we're comparing level of detail to level of scaling, however, then the process of calculating them is just that: comparing scale to detail. Here's a video explaining the process:


The generalized formula for a fractal dimension, then, is D = log(N)/log(1/r), where N is the ratio of detail, and r is the ratio of the measurement scales. You might think a mistake is made in the above video, since 4 inches gave us 8 steps and .5 inches gave us 110 steps, shouldn't the formula be log(110/8)/log(.5/4)? Note the 1 in the log(1/r) - it effectively flips the bottom ratio, and gives us a positive dimension instead of a negative one.

The work in the video was a quick-and-dirty measurement, resulting in log(110/8)/log(4/.5) = 1.26. This is actually pretty close to the actual answer of 1.25, as measured in Lewis Fry Richardson's original paper.

Mandelbrot's original British coastline paper is a little complex to read, as the application of the fractal dimension isn't a matter of a straightforward multiplication. However, there's a very accessible discussion, including more resources, about the British coastline paradox over at Ask Dr. Math.

I suppose I could pursue this further, but this is all the detail I'm showing at this level.

0

Grey Matters' 7th Blogiversary!

Published on Wednesday, March 14, 2012 in , , , , , ,

Mehran Moghtadaei's Pi Digit GraphicCan you believe it? As of today, Grey Matters has been around for 7 full years!

That means it's time to celebrate and have a little geeky fun. It's the perfect time for it, too, because 3/14 is special for other reasons, too.

March 14th also happens to be Albert Einstein's birthday. Here's a quick 1-minute look at one of Einstein's most important discoveries:


The minutephysics YouTube channel has another short video about him called Albert Einstein: The Size and Existence of Atoms.

If you want to understand more about the wave/particle duality idea, minutephysics has a clear, simple video on that, as well. You can find part 1 at this link, and find part 2 at this link.

For a more detailed, yet still clear, understandable, and fun explanation of the , there's the “Making Waves” episode of James Burke's The Day The Universe Changed, and the second half of The Universe: Beyond The Big Bang.

3/14 is, of course, also Pi Day, the geekiest holiday of the year! Numberphile has gone all out for the occasion, producing not just one, but four pi videos for the occasion!

It all starts with the main Pi video below:


Wait...go back to about the 7 minute mark in the video...did he say Pi was 3.142?!? I've had 400 digits of Pi memorized for quite some time, and I'm pretty sure it's 3.141, not 2. The standard mnemonic is “How(3 letters) I(1) want(4) a(1) drink(5), alcoholic(9) of(2) course(6), after(5) the(3) heavy(5) lectures(8) involving(9) quantum(7) mechanics(9)!”

The other Pi videos are about specific views on Pi. The topics are Bouncing Balls, Buffon's Needle (done with matches), and the Sounds of Pi.

The always fascinating and mysterious Vi Hart also has a treat for us. It's her tribute to Pi Day and Shakespeare (no, he was born on April 26th), done in iambic pentameter!


Well done, Vi. Thanks for everyone here, especially you, dear reader, for celebrate 3/14 and 7 great years with Grey Matters! Now, it's time to start working on year 8...

0

Quick Snippets

Published on Sunday, March 11, 2012 in , , , , , , ,

Luc Viator's plasma lamp pictureIt's time for March's snippets!

This time around, we have a selection of new and unusual approaches to using memory techniques:

• Back in January of this year, British Channel iTV premiered a new game show called The Exit List. Contestants answer trivia questions as they proceed through a “memory maze”, but there's a twist! Contestants must memorize an ever-growing list of the answers in order to exit the maze with the money. Correct answers add only one item to the list that must be memorized, while incorrect answers add four items to the list!

To make the game even more exciting, there's a hidden room in the last row containing $100,000 (the others contain $10,000) for correct answers, and also panic rooms, which can add lists of random letters (as opposed to the usual words or phrases) to your memory list. You can find episodes online to get a better idea of this Indiana Jones-meets-Simon game show.

This game show may be coming to America on ABC, as well, courtesy of the same people who brought Who Wants To Be A Millionaire? to the US.

• Joshua Foer, author of Moonwalking With Einstein, has given a talk on memorization techniques at TED 2012. At this writing, there is no video to accompany that article, but it will likely be available in the long run.

• If you enjoyed my posts on the MIT Blackjack Team, there's a new independent film out on a similar topic. It's called Holy Rollers, and is about a team of card counting Christians. From the trailer alone, it looks like it could be an interesting movie:


• If you've enjoyed my posts on the game of Nim, there's now a commercial desktop version of multi-pile Nim available. It's called Abacan, and is played by sliding beads along different bars from one side of the frame to another.

You can use what I've taught in my Nim posts to try and work out the strategy on your own, or you can just go to the multi-pile Nim Strategy Calculator, select 5 rows, and enter 1-3-5-7-9 for the sizes of the rows to get the winning strategy.

One final note: Ordinarily, my next post would be on Thursday. I'll be posting on Wednesday instead, as Wednesday is Pi Day (3/14)! Pi Day is also Einstein's birthday, and Grey Matters' blogiversary!

1

Draw the USA

Published on Thursday, March 08, 2012 in , , , , ,

Kyle Brooks' photo of USA license plate mapMnemonics are a great way to learn things like USA states, but they're not the only way.

Confucius once said, "I hear and I forget. I see and I remember. I do and I understand." In this post, we'll take that principle to heart and learn to memorize the states by doing, as opposed to just visualizing.

In this particular case, doing refers to drawing. Don't worry, you don't have to have any special drawing skills, or even any experience. All you need is pencil, paper, the desire to practice, and the practice itself.

Ken O'Brien of Mahalo.com will teach you how to draw the USA. The lessons start with this easy introduction on how to draw the 48 contiguous states:


The approach of breaking up the project into smaller, easier-to-manage parts is a great way to learn just about anything, not just drawing. When practicing this myself, I've found the recommended path is the best way to go:

Northwest
Southwest
Southeast
Northeast
Entire USA

You might be wondering why I'm bringing up drawing in a blog that usually focuses on memory and math feats. The real aim of this blog is to improve your mind, and have fun while doing it! Plus, focus and practice are essential to memory, anyway. When mastering the map, you might surprise yourself at how well you learn the states.

If you watch a documentary on the history of the states while practicing, it can help lock in each state. Not surprisingly, I found that watching How The States Got Their Shapes to be particularly helpful, since you get a better sense of the history and the reasons the shapes have those particular shapes.

Believe it or not, drawing a map of the USA can serve as a surprisingly entertaining memory feat, or even a bar bet. There are already some videos up of people impressing an audience by drawing the USA, and some of them taking longer than the 2 minutes that you should take to draw your map.

If you decide to present it as a feat, the facts you can learn from How The States Got Their Shapes can help add plenty of entertainment value. For example, are you familiar with the fact that the Tennessee/Georgia border is under dispute to this day?

Want another challenge after this? Take this feat to the next level by drawing the entire world. Just as with the USA, you can learn to do it from memory, or cheat a little and fold the paper to give you landmarks.

0

The Secrets of Nim (Pizza Nim)

Published on Sunday, March 04, 2012 in , , ,

NIM is WIN upside down!One of the great things about Nim is that you can adapt it to so many objects. For example, it would be easy to take standard Nim and play it with a pizza, so you could make sure that you, or the other person, always take the last slice.

If you're going to scam somebody with a fun food like pizza, though, shouldn't you be scamming them so as to get the majority of the pizza, or assure you at least get half? Thanks to a mathematician by the name of Peter Winkler, we know the answer.

If you and another person can take them in any order, then it's pretty easy to see that the pieces will most likely be taken in order of how big they are. If they're cut into equal slices, then even this doesn't matter.

To make it more of a challenge, we need rules. Here are the rules, based on Peter Winkler's investigation.

1) There are two players, whom we'll call A and B.
2) Player A names how many slices the pizza will be cut into.
3) Player B must cut the pizza by making all cuts from the center of the pizza to its crust, but is not required to make the pieces of equal size.
4) Player A gets to choose the first slice.
5) From that point, players alternate taking turns removing slices. Player B always follows Player A, and vice versa.

Here's the interesting spin on taking pieces, however:

6) After the first slice is taken, players are only allowed to take slices on their turn that are adjacent to the slices that have already been taken.

In other words, after the first piece is taken by Player A, there are only two slices from which either player can choose.

So, if you're Player A, the number of slices really only determines how many turns will be taken. The real question is whether it's to your advantage to state an even or odd number of slices.

Most people would think that they should state an odd number of slices. That way, they'd get to choose the first and last slices, thus winding up with 1 more slice than the other player, giving them the edge.

As it turns out, this is exactly wrong. Remember, it's not the number of slices that's your goal, but the greater share of the pizza, or assuring yourself at least half of the pizza. Player A should always choose an even number of slices.

To learn why, imagine that you, as Player A, request that the pizza be cut into 6 slices, and player B cuts the pizza in this manner:

Before taking your first piece, think of alternating pieces, regardless of size, as being in two groups. In the picture below, I've alternated the slices with red and green tints, to break them into separate groups.
At this point, ask yourself, which group, if any, contains a larger share of the pizza? Just by eyeballing the picture above, it's not too hard to see that it's the green group. But is there any way to make sure that you can obtain all the slices in the green group?

To help illustrate how this is done, I'll add the exact percentages, so we have a way to refer to each slice. Note that the green group percentages are 35%, 11%, and 8%, so we're going to insure ourselves 54% of the pizza:
Probably nobody will be surprised if you were to take that big 35% slice first, so that's your first move. Remember that only slices adjacent to the ones previously removed can be chosen. By removing the 35% slice, you're leaving them a choice between the 7% slice and the 29% slice, both of which are red. In short, they can't take a green slice!

Most likely, they'll take the 29% slice, leaving your next choice between the 7% slice (red) and the 11% slice (green). Since you've already determined that the green group contains the greater share of the pizza, you'll take the green 11% slice.

Notice what happens at this point. Once again, you've limited their choice to two slices, both from the red group (10% and 7%). They choose either one of those, and either way, they open up the final green 8% slice for you to take!

No matter how it proceeds, you can always make sure that they only get choices from the red group, while you can always make sure there's 1 green slice for you to take! Even if you were to start by choosing the smallest green 8% slice, by using this approach, you can still insure yourself the larger share of the pizza!

Since you examine the pizza ahead of time to see which group contains more slices, you can always guarantee yourself at least half of the pizza, if not more.

If you simply want to understand the approach and pull this on a friend the next time you have pizza, you have everything you need to know. However, if you want to delve deeper into the heavy mathematics of it, check out How to eat 4/9 of a pizza and Solution of Peter Winkler's Pizza Problem. One of the authors on those papers has also prepared this PDF presentation of the puzzle, which you may find helpful.

If you practice this and use it, enjoy your sweet, tasty victory!

0

Leap Year

Published on Thursday, March 01, 2012 in , , , ,

Sunday States newspaper with leap year headlineYesterday was leap day, so I thought it would be fun to take a closer look at why the leap year is the way it is.

And since so much thought is being given to the calendar, I'm having a sale on Day One, my updated and simplified approach to the classic day of the week for any date feat. Through Sunday, I'm selling it for 30% off - $6.99!

Now, let's get back to the leap year itself. Why do we even have it?

It would be nice if leap year didn't have to exist in the first place. The basic problem is that a day is measured by how long it takes the Earth to rotate once about its own axis, while a year is measured by how long it takes for the Earth to go around the Sun. These two measurements have no meaningful relationship to each other whatsoever, except for our desire to match them up.

C. G. P. Grey has a great analogy in this video, in which he asks you to imagine a ballerina doing repeated pirouettes on the back of a flatbed truck that's going around a closed track. Working out the relationship of the Earth's day to its year, then, is akin to trying to work out how long it will take the truck to complete 1 run around the track by counting the number of pirouettes the ballerina is doing.

The original Roman calendar had a length of 355 days, and occasionally had longer years of either 377 or 378 days to compensate for the errors. The problem with this approach was that the need for these years had to be calculated, and they weren't consistently applied throughout all parts of the Roman empire. If you wandered too far from home at this time, you couldn't be sure what day it was!

It was our old friend Eratosthenes who was behind the first push for a 365-day year, with a 366-day year every 4 years. However, the change wouldn't be made for almost another 200 years by Julius Caesar. The Egyptians were already using a 365-day calendar at that time, and the Romans could appreciate the wisdom of having a calendar that didn't require regular re-calculation, thus making standardization much easier.

So why did we need another change? Numberphile's video explains the astronomical problems simply in this video:


If I asked you what an astronomer is, you would reply probably reply that it is someone who studies the objects and behaviors of bodies in outer space. However, the original definition of an astronomer was someone who studied the movement of the Sun and the planets, in order to work towards a more accurate calendar.

After the fall of the Roman empire, it was the Catholic Church who had the major influence over society, including the calendar. One of their biggest celebrations was Easter, but this caused a few problems.

The first problem, of course, is that the Julian calendar was already drifting off by 1 day every 400 years. The next problem was the definition of Easter itself: It was to take place on the first Sunday after the first full moon after the vernal equinox (beginning of spring). See the problem? Now the orbiting of the moon must be thrown into the mix, as well! Even worse, that was only one possible definition of Easter, and there were many others.

The original solution was to try and approximate the correct date for Easter with a 19-year cycle. There was a way to make sure this stayed in sync with the Sun and the moon, but it could only be checked every 312.5 years!

By the 1500s, the years, cycles, and calculations for holidays were so out of sync, reforming the calendar became a major concern. The challenges to the church authority by Martin Luther provided the church with the perfect opportunity to put such large-scale reforms in place.

There was one more subtle problem that no one expected. Remember when I mentioned that the original definition of an astronomer as someone who was working towards a more accurate calendar? More accurately, that definition was the study of the movements of the Sun and the planets around the Earth, in order to work towards a more accurate calendar.

This assumption of the planets and the Sun going around the Earth was so basic, it wasn't something you'd ever really question. Unfortunately, since the calendar reform required taking a closer look at this motion, the discovery of the orbit caused a few problems.

As James Burke explains in the “Infinitely Reasonable” episode of The Day The Universe Changed, this caused it's own problems:


As you might expect, the calendar reform in 1582 didn't take hold everywhere all at once. Britain and its American colonies didn't adopt the calendar until 1752. Several countries, including Greece and Russia, didn't adopt this calendar until the 1920s!

That's only the nutshell version of the weird and twisted tale of how our current leap year system came to be.

The New York Times offers some fun Leap Year lessons you might enjoy. Some are geared towards a classroom, but others you can try out on your own, if you wish.