Showing posts with label controversy. Show all posts
1

Simple math? Not so simple

Published on Sunday, May 10, 2015 in , ,

mattbuck's Bayes' Theorem neon sign photoJust over a month ago, TheWeek.com posted an article titled The simple math problem that blows apart the NSA's surveillance justifications. It concerned the probability of detecting terrorists, when you have a near-perfect terrorist-detecting machine.

It turns out that the simple math isn't so simple.

Let's start with the question itself:

Suppose one out of every million people is a terrorist (if anything, an overestimate), and you've got a machine that can determine whether someone is a terrorist with 99.9 percent accuracy. You've used the machine on your buddy Jeff Smith, and it gives a positive result. What are the odds Jeff is a terrorist?
A better way to state the question is, “Given that the machine has identified Jeff as a terrorist, what is the probability Jeff is actually a terrorist?” Questions like this are known as conditional probabilities, and it turns out that Bayes' Theorem helps answer questions like this very effectively. If you're not already familiar with Bayes' theorem, read that post and watch the videos to better understand it before proceeding.

Unfortunately, the linked article above doesn't employ such computations, so we have to go about it ourselves. Let's assume the 99.9% (0.999) accuracy of the machine applies to detecting not only terrorists, but to identifying innocent people, as well. In turn, that means that the machine has a 0.1% (0.001) chance of identifying an innocent person as a terrorist, or identifying a terrorist as an innocent person. So, we have four different probabilities:

Chance that an actual innocent is identified as a terrorist: 0.001 (False +)
Chance that an actual innocent is NOT identified as a terrorist: 0.999 (True -)
Chance that an actual terrorist is identified as a terrorist: 0.999 (True +)
Chance that an actual terrorist is NOT identified as a terrorist: 0.001 (False -)

Let's put these numbers in the following table:

  Is a terrorist Is innocent
Identified as terrorist 0.999 (True +) 0.001 (False +)
Identified as innocent 0.001 (False -) 0.999 (True -)

Now that we've got the probabilities in order, let's see what happens when 1 terrorist and 999,999 innocent people are thrown into the mix. We'll multiply both entries in the “Is a terrorist” column by 1, to represent the 1 terrorist, and both entries in the “Is innocent” column by 999,999, to represent the 999,999 innocent people:

  Is a terrorist Is innocent
Identified as terrorist 0.999 (1 × 0.999) 999.999 (999,999 × 0.001)
Identified as innocent 0.001 (1 × 0.001) 998,999.001 (999,999 × 0.999)

We can double-check that the table has been correctly constructed, because all the numbers add up to 1 million. This covers all the data, so now we're ready to tackle the original question.

Remember that the question itself is “Given that the machine has identified Jeff as a terrorist, what is the probability Jeff is actually a terrorist?” In other words, we aren't concerned with the possibility of being identified as an innocent, as identification as a terrorist is already a given. All we have to do here is trim the “Identified as innocent” row out of the table completely:

  Is a terrorist Is innocent
Identified as terrorist 0.999 999.999

At this point, don't forget the basic probability formula: Probability = (targeted outcome) ÷ (total possibilities). What are the total possibilities here? 0.999 + 999.999 = 1000.998. What is the targeted outcome? It's that Jeff is a terrorist, which is 0.999. So, the probability is 0.999 ÷ 1000.998 ≈ 0.000998, or about a 0.0998% chance.

In more practical terms, once the 99.9% accurate machine has identified Jeff has a terrorist, there's still only a 1 in 1,002 chance that he's actually a terrorist! Granted, this isn't radically different from the 1 in 1,000 chance posted in the original article. However, in math, the path you take is just as important as the results.

1

Cheryl's Birthday Round-Up

Published on Monday, April 20, 2015 in , , , , ,

normanack's birthday cake photoThanks to a Singapore math exam, the internet is being driven crazy by the biggest problem in birthdays since the birthday paradox!

Here's the problem: Albert and Bernard want to know Cheryl's birthday, but Cheryl isn't willing to tell them directly. Instead, she gives them a list of 10 possible dates: May 15, May 16, May 19, June 17, June 18, July 14, July 16, August 14, August 15, and August 17. She then whispers only the month to Albert and the date to Bernard. The following discussion then takes place between Albert and Bernard:

Albert: "I don't know when Cheryl's birthday is, but I know that Bernard does not know, too."

Bernard: "At first, I didn't know when Cheryl's birthday was, but I know now."

Albert: "Then I also know when Cheryl's birthday is."

When is Cheryl's birthday? We'll look at how to find the answer in this post!

The simplest and most direct explanation of this puzzle I've found is in Presh Talwalkar's post, When Is Cheryl’s Birthday? Answer To Viral Math Puzzle. The included video makes the answer seem so straightforward:


Another helpful approach is Mark Josef's interactive Cheryl's Birthday page, on which you can click each of the dates to see why that the logic determines that date to be right or wrong. Both Cahoots Malone and The Washington Post have also featured simple and straightforward video explanations of this puzzle.

For a more detailed look at the solution, check out Numberphile's thorough explanation, as well the extra footage:


Ever the intrepid explorer, however, James Grime takes an even closer look at Cheryl's Birthday, and finds that the intended answer may not necessarily be the right answer:


Has this puzzle driven you crazy? Did you manage to solve it? If so, how? I'd love to hear your answers in the comments below!

0

Math and Politics

Published on Friday, October 04, 2013 in , ,

Scott Blake's mosaic of George WashingtonThe hot topic of the week has been, of course, politics.

I generally avoid politics on this blog, since it's far removed from my main focus of mental feats and techniques. However, there are crossroads where politics and math do cross paths.

Generally, the closest I get to politics is the basic stuff, such as memorizing facts about the USA. The advocacy side of things is best left to experienced political bloggers.

I do think it's important to realize that even politics can't escape the effects of math, and vice-versa. This brief introduction to Arrow's Theorem points out that an ideal voting system, as defined by the stated conditions, not only doesn't exist, but is impossible to develop.

For example, let's take a look at First Past The Post voting and its problems, with some help from CGP Grey:


Again, it's not that just this particular system is flawed, but that any voting system with the conditions set forth in Arrow's Theorem will be flawed. For an exploration of other voting systems, check out CGP Grey's other voting system videos.

It's not surprising that politics could be swayed in one way or another, as many accept it as part of the nature of the beast. Math itself, on the other hand, is heavily dependent on things such as proofs and peer-review, so there's no way that math could be corrupted by politics, right?

If you agree with that, James Grime and Numberphile have some bad news for you, as a recent study has findings to the contrary.


Hopefully, this brief post has given you food for thought, and maybe even discussion, in the likely and numerous discussions of politics in the days ahead. If you have any thoughts on mixing politics and mathematics, I'd love to hear them in the comments!

0

Even More Quick Snippets

Published on Sunday, November 18, 2012 in , , , , , , ,

Luc Viatour's plasma lamp pictureNovember's snippets are here!

This time around, we're treating you to a little history, a little controversy, and some eye-opening mathematics. You shouldn't get too lost, as this journey will mostly take place through the magic of video.

• Here's a young man by the name of Ethan Brown, together with his uncle, wrestling commentator Joey Styles. Even as young as Ethan is, he performs an amazing magic square routine using his Uncle's birthday:


Would you like to learn how to do this? This routine, known as the Double Birthday Magic Square, was developed by Dr. Arthur Benjamin, who has made the entire routine available on his website as a free PDF!

• There's a classic challenge known as the Monty Hall paradox/dilemma/problem. I've written about it in 2006, and again in 2010 (among other times). Earlier this month, AsapSCIENCE posted a new video on it that explains it quite well:


If you read my post on Bayes' theorem, you should recognize the equations that were written at about the 2:00 mark in the video.

It turns out Bayes' theorem is an excellent tool for explaining the Monty Hall problem. Using the tree diagram approach from the Bayes' Theorem - Explained Like You're Five video, with help from Wolfram|Alpha and the Syntax Tree Generator, I put together and posted this visual explanation of the Monty Hall problem over at the Magic Cafe. If you've struggled with this paradox before, this explanation may help clear things up.

Bayes' theorem really is powerful. For example, back in 2009, Air France Flight 447 disappeared off the radar and a long search began, not just for the plane and people, but for the reason as well. For 2 years, they searched for the airplane's flight recorder without luck, until they hired a team to use Bayes' theorem to narrow down a search area. After that, the flight recorders were recovered very quickly!

Even as powerful as Bayes' theorem is, it had a reputation as being bad mathematics through much of the 20th century. It's only recently that it's gained a wider respect. Sharon Bertsch McGrayne wrote a book on this history, called The Theory That Would Not Die: How Bayes' Rule Cracked the Enigma Code, Hunted Down Russian Submarines, and Emerged Triumphant from Two Centuries of Controversy. She talks about the controversy in the following 32-minute lecture at Singularity Summit 2011:


There's also a 55-minute video of her Google talk available. If you're curious about her mentions of Alan Turing and the Enigma machine, I have a post from July all about Alan Turing.

Numberphile has posted a number of good, enjoyable videos recently. Being interested in the Tau vs Pi fight (and let's not forget Eta), I enjoyed their Tau replaces Pi video:


Take the time to check the rest of their other recent videos out, as well. The explanations are always fun.

0

Bayes' Theorem

Published on Sunday, November 11, 2012 in , , , ,

mattbuck's Bayes' Theorem neon sign photoEver wonder what happens to those amazing breakthroughs you hear about on the news, but never hear about again? Somehow, when they're finally released, the amazing qualities of, say, that new wonder drug, never seem to reduce the suffering the way most people hoped.

Look through the reports on the test results of those breakthroughs, and you'll frequently find one line that says p < 0.05. In other words, the tests indicate that the results reported on in the report had only a 5% chance of happening randomly.

If I flip a coin 20 times, and heads shows up 15 or more times (in other words, greater than 14 times), we can work out that there is roughly a 2.07% chance of that happening at random. Reporting on this, we'd note that p < 0.05, and use this to justify examining whether the coin is really fair.

That works great for events dealing with pure randomness, such as coins, but how do you update the probabilities for non-random factors? In other words, how do you take new knowledge into account as you go? This is where Bayes' theorem comes in. It's named after Thomas Bayes, who developed it in the mid-1700s, but the basic idea has been around for some time.

You should be familiar, of course, with the basic formula for determining the probability of a targeted outcome:


The following video describes the process of Bayes' theorem without going into any more mathematics than the above formula, using the example of an e-mail spam filter:


To get into the mathematical theorem itself, it's important to understand a few things. First, Bayes' theorem pays close attention to the differences between the event (an e-mail actually being spam or not, in the above video) and the test for that event (whether a given e-mail passes the spam test or not). It doesn't assume that the test is 100% reliable for the event.

BetterExplained.com's post An Intuitive (and Short) Explanation of Bayes’ Theorem takes you from this premise and a similar example, all the way up to the formula for Bayes' theorem. It's interesting to note that it's effectively the same as the classic probability formula above, but modified to account for new knowledge.

The following video uses another example, and is also simple to follow, but delves into the math as well as the process. Understanding the process first, and then seeing how the math falls into place helps make it clear:


The tree structure used in this video helps dramatize one clear point. Bayes' theorem allows you to see a particular result, and make an educated guess as to what chain of events led to that result.

The p < 0.05 approach simply says “We're at least 95% certain that these results didn't happen randomly.” The Bayes' theorem approach, on the other hand, says “Given these results, here are the possible causes in order of their likelihood.”

If I shuffle a standard 52-card deck, probability tells us that the odds of the top card being an Ace of Spades is 1/52. If I turn up the top card and show you that it's actually the 4 of Clubs, our knowledge not only chance the odds of the top card being the Ace of Spades to 0/52, but gives us enough certain data we can switch to employing logic. Having seen the 4 of Clubs on top and knowing that all the cards in the deck are different, I can logically conclude that the 26th card in the deck is NOT the 4 of Clubs.

We can switch from probability to logic in this manner because we've gone from randomness to certainty. What if I don't introduce certainty, however? What if I look at the top card without showing it to you, and only state that it's an Ace?

This is the strength of Bayes' theorem. It bridges the ground between probability with logic, by allowing you to update probabilities based on your current state of knowledge, not just randomness. That's really the most important point about Bayes' theorem.

There's much more to Bayes' theorem than I could convey in a short blog post. If you're interested in a more in-depth look, I suggest the YouTube video series Bayes' Theorem for Everyone. I think you'll find it surprisingly fascinating.

7

Pi vs. Tau vs. Eta

Published on Thursday, June 28, 2012 in , , , , ,

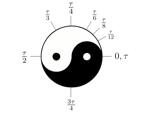
Michael Hartl's Tau-based unit circleToday is 6/28, making it Tau Day! Tau is a constant equal to 2 * Pi.

It sounds simple, and suggests that Tau shouldn't be a big deal. However, there is an entire movement to have Tau take Pi's place!

Let's start with good old familiar Pi (π). The following video, The Story of Pi, is a great refresher course on a very useful constant:


One of the most useful places for Pi is throughout the unit circle. If you need a refresher, here's a clear and simple Unit Circle tutorial.

With those concepts in mind, let's have Vi Hart explain why Tau (τ) is a better alternative to Pi.


There's plenty of support for Tau. Dr. Kevin Houston has another excellent intro to Tau, and Vi Hart even recently released a Tau Day song.

Michael Hartl, who began the Tau movement, offers a much deeper look at the effects of Tau in a 51-minute lecture, as part of his full Tau Day website. The Tau Manifesto itself is also available on the site for free.

Bob Palais classic article π is Wrong! (PDF link) is also considered to be a must-read for Tau enthusiasts.

Much of that was around for Tau Day 2011, however. This year, however, Tau faces an entirely new challenge!

The new challenger is Eta (η), which is ½π, effectively the inverse of Tau. David Butler's video shows the surprising uses of Eta, some of which rival Tau AND Pi!


That only leaves us π Day being on March 14th (3/14) and τ Day being on June 28 (6/28) is well and good, but when would we celebrate η Day? January 57th? Perhaps February 26th?

Why are we looking solely at the constant for change? How about changing the measuring unit? Since π is defined as a circle's circumference to its diameter, why not measure the circle in diameter lengths instead of radius lengths?

We could call these units “diameterians”, which would be equal to 2 radians. A complete circle would have π diameterians.

Notice that even from the seemingly simple shape of a circle, we can look at it from so many different ways. That's been part of the fun of putting up this post.

What do you think is the way to go? π? τ? η Diameterians? I'd love to hear your thoughts in the comments!

0

Leap Year

Published on Thursday, March 01, 2012 in , , , ,

Sunday States newspaper with leap year headlineYesterday was leap day, so I thought it would be fun to take a closer look at why the leap year is the way it is.

And since so much thought is being given to the calendar, I'm having a sale on Day One, my updated and simplified approach to the classic day of the week for any date feat. Through Sunday, I'm selling it for 30% off - $6.99!

Now, let's get back to the leap year itself. Why do we even have it?

It would be nice if leap year didn't have to exist in the first place. The basic problem is that a day is measured by how long it takes the Earth to rotate once about its own axis, while a year is measured by how long it takes for the Earth to go around the Sun. These two measurements have no meaningful relationship to each other whatsoever, except for our desire to match them up.

C. G. P. Grey has a great analogy in this video, in which he asks you to imagine a ballerina doing repeated pirouettes on the back of a flatbed truck that's going around a closed track. Working out the relationship of the Earth's day to its year, then, is akin to trying to work out how long it will take the truck to complete 1 run around the track by counting the number of pirouettes the ballerina is doing.

The original Roman calendar had a length of 355 days, and occasionally had longer years of either 377 or 378 days to compensate for the errors. The problem with this approach was that the need for these years had to be calculated, and they weren't consistently applied throughout all parts of the Roman empire. If you wandered too far from home at this time, you couldn't be sure what day it was!

It was our old friend Eratosthenes who was behind the first push for a 365-day year, with a 366-day year every 4 years. However, the change wouldn't be made for almost another 200 years by Julius Caesar. The Egyptians were already using a 365-day calendar at that time, and the Romans could appreciate the wisdom of having a calendar that didn't require regular re-calculation, thus making standardization much easier.

So why did we need another change? Numberphile's video explains the astronomical problems simply in this video:


If I asked you what an astronomer is, you would reply probably reply that it is someone who studies the objects and behaviors of bodies in outer space. However, the original definition of an astronomer was someone who studied the movement of the Sun and the planets, in order to work towards a more accurate calendar.

After the fall of the Roman empire, it was the Catholic Church who had the major influence over society, including the calendar. One of their biggest celebrations was Easter, but this caused a few problems.

The first problem, of course, is that the Julian calendar was already drifting off by 1 day every 400 years. The next problem was the definition of Easter itself: It was to take place on the first Sunday after the first full moon after the vernal equinox (beginning of spring). See the problem? Now the orbiting of the moon must be thrown into the mix, as well! Even worse, that was only one possible definition of Easter, and there were many others.

The original solution was to try and approximate the correct date for Easter with a 19-year cycle. There was a way to make sure this stayed in sync with the Sun and the moon, but it could only be checked every 312.5 years!

By the 1500s, the years, cycles, and calculations for holidays were so out of sync, reforming the calendar became a major concern. The challenges to the church authority by Martin Luther provided the church with the perfect opportunity to put such large-scale reforms in place.

There was one more subtle problem that no one expected. Remember when I mentioned that the original definition of an astronomer as someone who was working towards a more accurate calendar? More accurately, that definition was the study of the movements of the Sun and the planets around the Earth, in order to work towards a more accurate calendar.

This assumption of the planets and the Sun going around the Earth was so basic, it wasn't something you'd ever really question. Unfortunately, since the calendar reform required taking a closer look at this motion, the discovery of the orbit caused a few problems.

As James Burke explains in the “Infinitely Reasonable” episode of The Day The Universe Changed, this caused it's own problems:


As you might expect, the calendar reform in 1582 didn't take hold everywhere all at once. Britain and its American colonies didn't adopt the calendar until 1752. Several countries, including Greece and Russia, didn't adopt this calendar until the 1920s!

That's only the nutshell version of the weird and twisted tale of how our current leap year system came to be.

The New York Times offers some fun Leap Year lessons you might enjoy. Some are geared towards a classroom, but others you can try out on your own, if you wish.

0

Photographic Memory

Published on Sunday, July 24, 2011 in , , , , ,

60 Minutes' eidetic memory report The holy grail of memory is considered to be eidetic memory, what is more commonly as known as a photographic memory.

Currently, there's plenty of skepticism about it. That's largely because there's so little scientific study about it, coupled with the rarity of finding anyone who truly has it. Fortunately, that's all starting to change.

If you've spent more than 5 minutes reading Grey Matters, you realize that there are many clever ways to simulate a great memory, and even to use a trained memory to appear to be far better than the true credit it deserves.

We'll start with a 2010 National Geographic story about Gianni Golfera. He's being studied by researchers because of his extraordinary memory abilities. However, he has also learned, created, and taught memory systems that anyone can use, so there's a question of just how much of his memory is due to biology and how much is due to practice and determination.


More recently, it's been discovered that there is a specific type of enhanced memory, called “hyperthymestic syndrome”, or less technically, “superior autobiographical memory”, that may be at the heart of this unusual phenomena. I mentioned this briefly back in 2008 on my post about Jill Price.

In that same post, I also mentioned that Taxi star Marilu Henner is also hyperthymestic. Late last year, she appeared in a 60 Minutes report about superior autobiographical memory with some others with the same condition.

This is worth watching, because it's a more detailed account of the condition, the people who have it, and the state of the current research about this little-understood phenomenon:


Along with the main report, CBS also posted two short bonus footage segments. In the first, Lesley Stahl puts Louise Owen's memory to the test, and in the second, Marilu Henner compares the experience of having such a remarkable memory to time traveling.

As someone interested in memory, even though my own interest is largely in entertainment, I do believe this research could prove to be quite interesting. If you have any thoughts or experiences you'd like to share about this unique form of memory, I'd love to hear about it in the comments.

0

Iteration, Feedback, and Change: Real Life

Published on Sunday, May 29, 2011 in , , , , , ,

James Burke screenshot from JamesBurkeWeb's channelIn the previous post, I talked about artificial life and used it to demonstrate the amazing complexity that can develop from the simplest rules.

That kind of complexity developing from simplicity is a concept so counter-intuitive that it wasn't been part of humanity's collective mental toolbox for most of recorded history. Since it's very difficult to conceive of this, even with a feedback component involved, the only two alternative explanations left for the average person are pure chance, and the existence of deities.

If you consider the chance argument, you have to look around at the complexity of the world around you and consider that the odds of this developing by pure chance are very, very low, about 1 in a “squintillion” (a word coined by Harry Lorayne to describe any number that is so long, you have to squint to see the last numbers).

Now, consider the argument for the existence of a deity or deities. In Douglas Adams' speech, Is there an Artificial God? (originally given, interestingly, at an artificial life conference), gives a wonderful explanation in the following video of how this argument must have first developed:


Certainly, the concepts of iteration, feedback, and change were understood on a basic level, but when it came to explaining the world around us, it didn't seem possible as an explanation.

So, with a deity-created explanation, especially considering how much more satisfying it is than dumb luck, how did we go from that to start understanding the power of iteration, feedback, and change?

As so often happens in history, it began with attempts to fit the world around us into the explanation we had, and examining the problems encountered by trying to do that. In the following episode of James Burke's The Day The Universe Changed, called Fit To Rule, James Burke begins just as all that is about to fall apart. Our starting point is this wonderful introduction:

OK, Let's get the story off to a cracking start. Here's Linnaeus, the fellow who'd been up north. A really dull botanist, wandering around the really dull world they'd all made for themselves.

Not a hair out of place, so to speak: symmetrical, balanced, like their architecture. This is the type of stuff you go for if you're sure, as they were, that the world was created at 9 A.M. on October 26, 4004 B.C., and was never going to change: cool, geometrical.

They put nature in a pot in a garden because that's the way the world was for people like Linnaeus: regimented.

Where do we go from there? Watch and learn:


The Day The Universe Changed 08-10 Fit to Rule... by costello74

As you can see, the effects of studying real life changed more than just our views on iteration, feedback, and change. Quite naturally, it ran up against the previous view of the world that people had held onto for thousands of years.

Now, the three versions that affected 20th century life so much had two main things in common. First, the Haeckel, Sumner, and Marx views were all based on the struggles of the pasts of their respective countries, as well as on hopes and designs for the future.

Of course there are differences. Haeckel and Marx were trying to apply natural laws to a society in order to pave the way to a superior society. Sumner's version didn't try and design the outcome as it did to try and allow the struggles of society itself to determine the end.

The second thing that all three versions had in common was that they all focused on the struggle. If evolution was complete and right, then everyone should be always be struggling for everything. But if everything is struggle, then things like trade, property, and even the tiniest villages should never have existed, as they all require some form of cooperation.

The human body of knowledge, of course, is never complete, which was part of the problem here. Strangely enough, it was the Cold War itself that would bring the next piece of the puzzle into focus, and help us understand cooperation vs. struggle in a larger sense.

How did it do that? That's the subject of the next post in this series.

0

BBC: What Makes a Genius?

Published on Sunday, November 28, 2010 in , , ,

Marcus du Sautoy on the Story of MathsIf you enjoyed Marcus du Sautoy's 2008 documentary Story of Maths, you'll be happy to know that he's been chosen to host a few episodes of the BBC show Horizon.

His most recent appearance to date was on an episode called What Makes a Genius?, that should also be of interest to Grey Matters readers.

In this episode, Marcus continually asks the question, what makes the brain of a genius fundamentally different from the brain of someone who isn't a genius?

He starts off by demonstrating what most people think of as genius, with the help of Grey Matters favorite, Dr. Arthur Benjamin. Dr. Benjamin helps explain the difference between developing a skill, such as those he demonstrates, and the quality of creativity that is the true hallmark of genius.

From there, he goes back to the old arguments of nature vs. nurture, and we begin to learn how recent research is proving that both sides are more dynamic than was originally believed.

Here's the entire What Makes a Genius? episode of Horizon:

0

BBC: The Story of Maths

Published on Thursday, November 18, 2010 in , , ,

Marcus du Sautoy on the Story of MathsI love learning about history, as evidenced by my work annotating James Burke's documentaries. My favorite of James Burke's show would have to be Infinitely Reasonable, as it actually discussed the history development of science and mathematical thought.

I always thought a longer discussion of the history of math would be interesting. It seems that the BBC and Oxford Mathematics Professor Marcus du Sautoy agree, as they produced and aired a 4-part documentary back in 2008, called The Story of Maths.

In this post, you can watch all 4 complete episodes, as long as they're available on YouTube. If you have any trouble viewing the videos below, you can still probably find the episodes on YouTube, or via a Google video search.

The first episode, The Language of the Universe, begins with the importance of math in our modern life, before going on to explore the origin and development of math in the ancient western countries of Egypt, Mesopotamia, and then Greece.


After the fall of Greece, scientific and mathematical development came to an unfortunate halt. However, in the eastern countries, math continued to expand and develop. In The Genius of the East, we learn about the influence of China, India, and the Middle East. It also discusses the effect of these developments on western countries as the Renaissance began.


With a renewed European interest in mathematics, we see great gains over the next few centuries in modeling and analysis from Minds like Descartes, Leibniz, Newton, Euler, and many others. In the third episode, we see how the work of men long ago helped take us to The Frontiers of Space.


What could possibly be left? Not only does mathematics itself continue to develop, but there are still numerous problems from the past that still haven't been solved. The effect these have on the current state of math, and their future potential, is the subject of the final episode, To Infinity and Beyond.

2

Memorization VERSUS Understanding?!?

Published on Thursday, May 27, 2010 in , , , , , ,

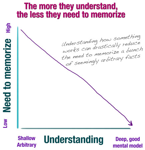
Memorization vs Understanding GraphFor sometime now, I've been wanting to write a post on one of my major pet peeves: The old argument about memorization vs. understanding.

Let's start with the critics of memorization. Lisa VanDamme's article The Real Math Magic: Understanding vs Memorizing, while focused on mathematics, is typical of the arguments of understanding as opposed to memorization.

First, too many take “memorization” to mean simply rote memorization – just repeating things over and over again until your memory retains them. If this is what is truly being argued against, then I'll give the opposition their due.

However, between techniques like mnemonics, spiral learning, spaced repetition, and more, the techniques are much richer than simply repeating things to memorize them.

We've established that the techniques are richer than most people believe, but what about the benefits of memorizing? It's a little political, but Michael Knox Beran's article In Defense of Memorization does discuss the benefits of the classic form of scholastic memorization. Why Memorization Helps Kids to Learn, by Dr. Rick Bavaria, sums up the benefits of memorization more succinctly and directly.

Don't get me wrong, I'm not arguing for the elimination of understanding. One of my favorite sites, as regular readers know, is BetterExplained.com, where clarity of understanding is their goal. Indeed, their post A Gentle Introduction To Learning Calculus not only clearly explains the basis of calculus, but makes a good argument that calculus should be taught earlier, not later.

Dan Meyer, while arguing that math class needs a makeover, actually discusses exactly how to overcome the impediments to understanding that most students have:


When you boil the arguments down, it comes down to the fact that memorization and understanding should work together in learning. In talking about how to get users to RTFM, the Passionate Users Blog makes an interesting point: the more you can get someone to understand something, the required memory work decreases.

Note also, that the graph at the above article runs from “High” to “Low”, not “Everything” to “Nothing”. In other words, there will always be a need for some memorization, regardless of your level of understanding. For example, since mental models are rarely perfect, there will usually be a need to memorize the exceptions to the rules.

What are your thoughts and experiences on the classic memorization vs. understanding argument?

0

Scam School Meets Monty Hall

Published on Thursday, April 08, 2010 in , , , , , , ,


Scam School logoAbout 4 years ago, I discussed the Monty Hall dilemma.

As you'll note above, Scam School turns its attention to the same dilemma this week.

Since my original post, many online simulations have turned up that you can try:

Cut-The-Knot Version 1 (Java applet) - In this version, you play the game yourself in the standard way.

Cut-The-Knot Version 2 (Java applet) - This is the simulation version I originally posted in the Monty Hall dilemma post above. This versions asks you to choose a door, then opens up all 3 doors, and records what would've happened with and without switching. Once you've got the basics of the problem down, this version helps you get better insight into why the odds work.

Let's Make a Deal (Java applet) - This is a straightforward version that keeps track of the history of your choices and their outcomes.

The Monty Hall Page - This one is interesting because it also offers an alternative version of the game, in which the host doesn't know what is behind the doors.

Monty Hall's Paradox (Java applet) - Here, you set up the number of games, whether you're always going to switch or never switch, as well as whether the host knows what is behind each door, and then the applet runs the problem for you over and over. This is perfect for seeing the long term effects of your choices. Even running with the same set-up proves interesting, as you can see the fluctuations.

If you tried any of these out for yourself, I'd love to hear any interesting experiences and results you had. Let me hear about them in the comments!

1

Voting and Mathematics

Published on Sunday, August 09, 2009 in , , , ,

Vote SmartWhile the blogosphere isn't exactly devoid of political posts, I thought I'd add one with a different twist - a discussion of the mathematical side of voting.

Let's start off with a simpler but nonetheless confounding situation. Imagine a poll of 3 political candidates' popularity is taken. When the results are released, the polls show that 2/3 of voters prefer A to B, and also that 2/3 of voters prefer B to C. Obviously, the voters must definitely prefer A to C, right?

Not necessarily. Surprisingly it is still possible for 2/3 of voters to prefer C to A! In his book, Aha! Gotcha!, Martin Gardner gives a clear example of exactly how this is possible in the section on the Voting Paradox.

The principle causing the apparent contradiction is known as non-transitivity. I've even discussed the idea of employing non-transitivity and politics together, albeit for entertainment, in my Remembering the Election post. While you can find out more about the nature of non-transitivity from Martin Gardner's works, and it will help you understand some of the following discussion, I don't want to veer off the political topic for now.

It's largely non-transitivity that keeps US elections limited to two-party elections, with third-party candidates acting as little more than spoilers. Steven J. Brams, author of Mathematics and Democracy, briefly discusses this in his Plus Magazine article, Mathematics and democracy: Approving a president:

The system used in the US — and many other places, including the UK — is known as plurality voting (PV). PV is based on the "one person, one vote" principle: every citizen casts only one vote for his or her preferred candidate, and the person with most votes wins. But PV has a dismaying flaw: in any race with more than two candidates, PV may elect the candidate least acceptable to the majority of voters. This frequently happens in a three-way contest, when the majority splits its votes between two centrist candidates, enabling a more extreme candidate to defeat both centrists. PV also forces minor-party candidates into the role of spoilers, as was demonstrated in the 2000 US presidential election with the candidacy of Ralph Nader. Nader received only 2.7% of the popular vote, but this percentage was decisive in an extremely close contest between the two major-party candidates.


That whole article is worth reading, especially in relation to alternative voting procedures of which you may never heard, but are nonetheless mathematically valid ways of choosing a leader.

An excellent companion article to this book can be found in Martin Gardner's The Last Recreations, in which he reprints an excellent article in his Voting Mathematics column (this is a limited preview article, so some pages are missing).

Interestingly, the US legal system is already preparing to hear mathematical alternatives to our current voting systems. One of the aspects of the US political system that generates the most discussion for improvement is the Electoral College system, especially where it concerns the division of districts and the potential for Gerrymandering.

Back in 2006, a case concerning congressional redistricting in Texas reached the Supreme Court. Interestingly, Justice Kennedy issued a plea in his opinion for workable standards of congressional redistricting. Unfortunately too late for the Texas court case, mathematician Zeph Landau has proposed a workable idea he says is ready for the next such challenge. While the linked article describes the mathematics in more detail, it's easier to explain it with a recent Jif Peanut Butter ad that uses exactly the same idea. Think of the boys as the two parties, the mom as a third-party member without any stake, and the bread as the state:


Alas, much of this discussion is theoretical for now, as such major changes to the election system would be, by definition, unconstitutional in the US. So, until judges rule such systems to be within constitutional bounds, or an amendment is ratified to change things, we'll unfortunately probably be seeing much of the same for the foreseeable future.

0

How much is $700 billion? (Part II)

Published on Thursday, October 02, 2008 in , , ,

US$315 billionMy previous post, How much is $700 billion?, proved so popular and generated so much discussion, that I'm able to bring you more visualizations of $700 billion.

In that last post, we finished with visualizing $700 billion in pennies, so let's start with dollars this time. This site will show you what $315 million looks like in $1 bills. Picture another stack of the same size right next to it, and then a third stack that's between 1/4th and 1/5th of the size of either of the others stacks, and you'll have $700 billion.

Next, let's move from real money, like pennies and dollar bills, to counterfeit money. What would it take if you decided to print $700 billion in counterfeit bills out on your inkjet printer? Frank Gibson describes this apporach in disturbing detail over at That Blog Frank Used to Have. While I don't suggest actually trying this, the process is fun to visualize.

700 billion of anything is large, so what about applying this to other units besides money?

Let's try it with distances. If you were 700 billion meters from Earth, you would get this view:


That bright spot in the middle of the picture is the sun, and those rings represent the orbits of Mercury, Venus, Mars and Earth.

If this picture looks familiar then you've probably seen the Powers of 10 video. Their photo of 1 trillion meters from Earth was edited down to 70% of the area to make that view. If that still doesn't impress upon you how far 700 billion meters is, start at the sun here, and scroll right until you get to Mars.

Take a sheet of writing paper, and fold it in half. Keep folding it in half until you can't make another fold. Most likely, you won't get beyond the 7th fold, because at that point, you're trying to fold 128 layers of paper in half. Back in 2005, Britney Gallivan actually worked out how to fold a piece of paper in half 12 times, resulting in 4,096 layers of paper. If you wanted to fold a piece of paper in half enough times to have more than 700 billion layers of paper, you would have to figure out how to fold it in half 40 times. Assuming 1 layer is a standard paper thickness of 1/10th of a mm, the resulting 1,099,511,627,776 layers would reach more than a quarter of the distance from the Earth to the moon!

Instead of distances, though, let's try time. How long ago was 700 billion seconds? 1 million seconds ago was just over 11.5 days ago. 1 billion seconds ago was roughly 31.68 years ago. That means that 700 billion seconds ago was 22,182 years ago (In 2008, 22,182 years ago would be 20,174 B.C.)! Humans were on Earth at that time, but the first civilizations wouldn't appear for another 8-10 millenniums (not years or centuries, millenniums)!

Coming around full circle to money again, have you ever played the lottery? I don't mean those scratch-off cards, but the games where you pick 6 different numbers from 1-50, and then hope those same numbers are picked in a drawing. Try this lottery simulator to get a feel for just how difficult this is. The probability of picking the exact right 6 numbers is 1 in 11,441,304,000 (greater than 1 in 11.4 billion).

Does that seem frustrating? Imagine that the lottery asked you to pick 7 numbers from 1-50 instead! The probability of that would be 1 in 503,417,376,000 (greater than 1 in 500 billion). Even playing Keno in Las Vegas, where you have to pick the correct 6 numbers in a range of 80 (1 in 216,360,144,000) offers a better chance than that!

People who want to take your money via gambling want your chances of winning to be as low as possible so they can bring in money, but still seem high enough to get potential players interested. Think about this: If people like that won't even offer a game whose probability of a player winning is even half of 1 in 700 billion, what does that tell you about the size of 700 billion?

3

How much is $700 billion?

Published on Sunday, September 28, 2008 in , , ,

Sears Tower in US penniesUS$700 billion, the proposed amount of the financial institution bailout, is a big number to wrap your head around. Just how much is US$700,000,000,000?

First, let's think of it in terms of grains of salt. A tablespoon of salt contains roughly 100,000 grains of salt. A 1/2 cup of salt contains about 1 million grains of salt. How much is 700 billion grains of salt? Picture an average public school classroom filled up about 70% (between 2/3 and 3/4) of the way with salt! Even on senior prank day, that would result in immediate suspension.

Even more fun, think of getting this $700 billion in pennies - that's 70 trillion (with a t) pennies!

First of all, getting 70 trillion pennies would be impossible, as if you were to total all the various pennies minted by the US government since 1787, that would "only" come to 300 billion pennies (by most estimates). About a third to a half of those are either lost, destroyed by the mint, or are otherwise no longer accepted as legal tender (and probably in the hands of numismatists). That leaves about 140-200 billion pennies still in circulation, or $1.4 to $2 billion dollars in pennies. The US would have to be in existence for another 513 centuries (not years, centuries) before we'll have minted 70 trillion pennies!

Back to our main question, how many is $700 billion in pennies?

According to the MegaPenny project, it would take a stack of two trillion, six hundred twenty-three billion, six hundred eighty-four million six hundred and eight thousand pennies (that's 2,623,684,608,000 pennies or $26,236,846,080 - just over $26 billion) to build a life-size replica of Chicago's Sears Tower, ignoring the antennas on top.

Think about this: You could use $700 billion in pennies to create 26 complete, full-size replicas of Chicago's Sear's tower! And you would still have more than US$17 billion dollars (US$17,842,001,920 to be exact) in pennies left over!

According to the official US population clock, the US population at this writing is slightly less than 305.3 million people. If you divide up the remaining US$17.8 million up among all those people, you could send them more than $58 each!

What would happen if we simply divided up the full $700 billion among the current US population, without creating Sears Towers replicas? Each person would get US$2,292.82!

Now, since the proposed $700 billion bailout is money being taken from you, not given, this last amount is an even more interesting number to remember.

Think of it this way: Instead of just letting these companies fail, having stockholders remove the people who made the bad decisions in the first place, and have the companies slowly try to rebuild their reputation among stockholders and customers, everyone in the US, for only about $2,300 each, can keep the people who made the poor decisions in place, and give them completely new money with which to make those same bad decisions!

Gee, what a bargain.

Update (Oct. 2, 2008): You can find even more visualizations of 700 billion in Part II of this post.

0

The States Mis-Stated

Published on Sunday, May 18, 2008 in , , , , ,

USAIt was a little over a year ago that I last focused on the states, so it's time to visit them again (so to speak).

During a recent speech in Oregon, US Presidential candidate Barack Obama recently made a newsworthy mistake when stating that there were 60 states total (57 visited states + 1 unvisited state + 2 states, Alaska and Hawaii, that won't be visited):


Also, when asked why he's losing to Hillary Clinton in Kentucky, this story mentions that Obama replied:

What it says is that I'm not very well known in that part of the country," Obama said. "Sen. Clinton, I think, is much better known, coming from a nearby state of Arkansas. So it's not surprising that she would have an advantage in some of those states in the middle.


Being an Illinois senator, you'd think he'd realize that not only is Illinois closer to Kentucky than Arkansas is, but that Illinois shares part of its border with Kentucky. Hopefully, this will not develop into a meme for him. Now, if you wish to make political hay over this, there's plenty of forums and sites that will let you comment on it (Any comments of a political nature here will not be posted).

My focus is on the fact that a mistake like this is surprisingly common. It might be the number of states, or forgetting the name of some of the states (much easier to do), but there a number of mistakes to be made about the states.

Not long before the above speech, Stacy Kate of the Hello...This Is Me blog had mentioned an episode of Friends I'd never seen or heard about. It was a Thanksgiving episode where Chandler challenges everyone to name all 50 states, and it becomes torture for Ross who can't remember all 50. It was called The One Where Chandler Doesn't Lie Dogs, and you can see it online, with Part 1 here and Part 2 here. Note that most of the characters miss one or two, and Joey gets 56!

Naturally, I'm always on the look out for ways to help others improve their memory about the states. One of my favorite tools for this has always been, of course, Wakko's 50 State Capitals song from Animaniacs (and even he makes a mistake at the end!).

A newer way to remember the states is the rather ingenious 50 States of Mind website. In the opening graphic, you can click on any state, and you'll see an unusual graphic in the shape of that state. While they are unusual, the graphics are mnemonics for facts about that state. For example, Pennslyvania is shown as a bag full of pens and pencils, with a star on the bag marking the capital, Harrisburg, and the store logo on the bag being from a company called William's Pens and Pencils, to help you remember Pennsylvania's founder, William Penn.

Some of the state pages, like the one for Colorado, have a starred button next to the state. If you roll your cursor over those stars, you will see a state map imposed over the graphic. At least there's no mistakes on this si . . . wait . . . the rollover graphic shows the correct capital, Denver, but the caption above the state says the capital is Boulder!

So far, these state links are proving to be good reason to double check your geography knowledge before presenting it.

As long as we're having fun with state mistakes, I'd like to wind up with a few of my favorites. The first one comes from a news story about the state of Georgia's first execution in 7 months. As it is now, there's nothing wrong with the story, but when it was originally posted, the story looked like this:


The included map, if you can't tell, is of the country of Georgia, not the US state.

Of course, if you're wondering why so many Americans have trouble with their geography skills, there's really only one person to ask – Lauren Caitlin Upton, better known as Miss South Carolina Teen USA 2007:


To be fair, she has played off her unfortunate fame from this in, what I think, is one of the smartest moves she could have made. She paired with People Magazine to create this interactive geography quiz. It's interesting to laugh at her goof one minute, then have her best you in geography knowledge the next.

So, how confident are you in your knowledge of all 52 states? (Yeah, I had to make at one mistake in this article on purpose.)

1

21: The Movie

Published on Thursday, March 06, 2008 in , , , ,

21: The MovieThere's a new movie coming out at the end of this month, about the MIT Blackjack Team. Check out the trailer for 21.

The movie concerns a team of MIT students who learn basic strategy, card counting, money management, and other techniques that allow them to develop an edge when playing blackjack. The team was a reformation the original MIT Blackjack Team from the 1970's, but with the new '90s version being run as a business called Strategic Investments. The movie is largely based on the book Bringing Down the House: The Inside Story of Six MIT Students Who Took Vegas for Millions, by Ben Mezrich (whose character becomes Ben Campbell in the movie).

Documentaries have been made about the team, including a BBC documentary called Making Millions The Easy Way. The program itself isn't available online, but the BBC has provided an excellent program summary, question and answer column, and even a complete transcript of the documentary.

The History Channel's documentary on the topic was called Breaking Vegas, which was popular enough to be developed into a short series about people who tried to beat the casinos (both legitimately and otherwise). This special is shown here (complete with commercials):


From the look of the movie trailer and the official site, it looks like it's going to be a stylized version of the story, but adding some drama to it should be good for the storytelling. I like this kind of story not just because of the mathematical hero, but also the basic little-guy-vs.-big-guy aspect of the story. It's also a great story of people beating the odds by using their brains, but without the brains coming off as superhuman. As you'll see in the movie, documentaries or book, they still have to face their emotional sides, too.

0

Messing With Pi

Published on Thursday, February 07, 2008 in , , , ,

PiDid you ever receive that e-mail that claims that some state's legislature (usually Alabama) has recently passed a law redefining Pi? As Snopes notes, this is false. However, 111 years ago this week, the Indiana state legislature came very close to doing just that.

The change wasn't done to make Pi consistent with the Bible, but rather to deal with the age-old problem of trying to construct a square with the same area as a given circle, otherwise known as squaring the circle. Because Pi is transcendental, we now know that this is impossible.

However, what if you were working before the 19th century, before this was proved, and before calculus? There are numerous ways to get very, very close to the circle, and it's not unreasonable to think that just a few more adjustments would be needed to perfect the process. Let me show you how the madness takes hold. One of the best approaches I've found for seemingly squaring the circle was detailed by Stu Savory in April, 2005 (26 days too late if you ask me). He does a good job explaining, but I'd like to break it down a little differently for my readers. It uses only a compass and a straightedge.


We start by working on the line that will become the circle's diameter. Draw a horizontal line, and mark the rightmost end as R. Open the compass to a width of an inch or so, place the spike of the compass at R, and mark point T on the line to the left of R. Now place the spike on T, and mark a point to the left of T (not labeled). Place the spike on this unlabeled point, and mark one more point to its left, which will be labeled O. In short, OT should be exactly twice as long as RT.

Now, open your compass to length OR, with the spike at O. Use the compass to draw a circle. Mark as P the point where the horizontal line intersects with the circle on the left. Our final step concerning the diameter line itself (POR) is to bisect OP (Java required), marking OP's midpoint as H.

Next, we're going to make some measurements above POR. Construct a vertical line from point T. Mark the point at which this line intersects the circle as Q. Using the same length as QT, draw a chord starting at R. Mark the other end of this chord as S (length of QT=length of RS). Draw a line from S to P. Construct a line parallel to RS through point T (Java required), marking the point where it intersects SP as N. then construct another line parallel to RS through point O, marking the point where it intersects SP as M.

Finally, we're going to work below PQR, and get our square's base measurement. Set your compass open to length PM, with the spike at P. Swing the compass to mark the point K, below POR, on the circle's circumference, and draw the PK chord (PK=PM). Set your compass to the length of MN, and then construct a tangent at a right angle to POR, marking the bottom-most point of this tangent as L. Draw lines RL, RK and KL. Finally, construct a line parallel to LK, going through point C. Mark as D the point where this line intersects RL.

So what does this give us? RD is the base of our square we need. Let's work through this next part slowly.

The formula for the area of the circle, as we all learned in school, is Pi * r2. The formula for a square with a base of x is x2. Because of the way in which these measurements were done, RD will always be a straight line about 1.772453 times longer than RO, the circle's radius. As it happens, this is the square root of Pi!

In other words, the length of line RD equals the circle's radius times the square root of Pi ((sqrt(pi))*r). Using RD as the base of a square, we can get the square's area by multiplying this by itself! Squaring the square root of Pi gives us Pi, of course, and squaring r gives us r2, or Pi * r2 for the area of this square!

Everything seems right, but can you figure out why this isn't a true squaring of the circle? What actually winds up happening is that RD is the square root of 355/113, a common rational fraction used for Pi early on. 355/113=3.1415929204, which is accurate to 6 places after the decimal point! It's square root is 1.7724539262, which also accurate to 6 places after the decimal point. This gives a square and a circle that are so close in area that, using a pencil that could mark in 1/100 of an inch, you would have to create a circle more than 4 miles in diameter to see your error!

If you look at the bottom of Stu Savory's blog entry, he has a quicker and more interesting way of apparently squaring the circle with a compass, straightedge and a coin!

Are you beginning to see why so many people were obsessed with squaring the circle? When you don't know that Pi goes on forever, it seems to be a matter of just making a few more adjustments to make a historical mathematical breakthrough! This was actually so common that, at one point, the insane belief that one could square a circle was listed in medical texts as morbidus cyclometricus!

I hope you've enjoyed this rather odd look at a weird bit of mathematical history.

0

Big Mac vs. 10 Commandments

Published on Tuesday, October 30, 2007 in , , ,

Big MacThere's some interesting news coming across the wires about the modern American memory. According to a Kelton Research survey, more Americans can name the ingredients of a McDonald's Big Mac than can name the 10 commandments.

What makes this finding especially interesting is the famous two all beef patties, special sauce, lettuce. cheese, pickles, onions on a sesame seed bun promotion only ran on TV from 1975 to 1976, and outside of online video sites and TV Land's Retromercials, hasn't really been seen since.


I think it's humorous, and ingenious, that McDonald's most memorable ad campaign features people forgetting their ad campaign.

Part of what makes the 10 commandments so tricky to remember is that different Judeo-Christian religions have different versions. The Protestant, Hebrew and Catholic commandments are actually worded and ordered differently, even though they contain the same basic ideas (the survey did take this into account). Interestingly, the list most refer to as the commandments are spoken in Exodus 20, but never referred to as being on tablets or even as being called the 10 commandments. In Exodus 34, there is a vastly different list than the one with which most people are familiar, yet it is this list that is specifically mentioned as being the same as the first set of tablets, and is the only list in the Bible passages that is specifically referred to as the 10 commandments.

If you do want to learn the list classically referred to as the 10 commandments, spend the next 3 minutes watching the following video, and you'll have them down in no time!