
 Even when you think you understand a concept, even one as simple as basic multiplication, you can come across a different perspective that makes you take a closer look.
In this post, we'll look at an almost magical way to multiply in a very visual manner!
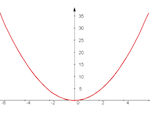
Tipping Point Math recently posted this unusual multiplication technique in their Multiplying with a Parabola! video:
I had to try this technique out for myself, so I headed over to Desmos.com and created this interactive version (The image below also links to the interactive version).

The Desmos.com version lets you multiply any 2 whole numbers ranging from -15 to 15, using the sliders in boxes 2 and 3 on the right. Clicking on the dot where the line crosses the vertical (y) axis will display the coordinates, and the y-coordinate will be the answer to the multiplication problem. You can also click the arrows just to the left of boxes 2 and 3 to start and stop animation of the points.
Play around with it for a while, and discover the possibilities. By clicking on the wrench image on the upper right side of the screen, you can adjust the settings, including “Projector Mode”, which can make the graph less cluttered.
Working with this interactive version, you'll quickly find the answer to the challenge of multiplying 7 by -4 given in the video above. You may also find new questions, however!
For example, setting the sliders to multiply 5 by -5 puts the 2 lines in the same place, and gives the same point! With only 1 point, how does the computer know at what slope to draw the line? The short answer is that there's a bit of a cheat here. The computer will always draw a line through the coordinates (a, a2) through (0, ab), so the line is forced to give the right answer. More generally, though, there is a surprising way to mathematically define a line with a single point, as explained in this half-hour video about Galileo's laws of falling bodies.
Surprisingly, this basic idea can be expanded to handle a wide variety of calculations. For example, James Grime uses the graph of y = x3 - 3x to create his cubic curve calculator:
Graphical calculators such as this are known of nomograms, and are often both an art and a science. Ronald Doerfler's My Reckonings blog has some amazing examples of nomograms that are likely to boggle your mind. Even some of the simpler nomograms, such as this Educated Monkey tin toy, or this nomogram from Popular Mechanics for calculating the day of the week for any date, are still astounding to use and explore.
If you've run across any interesting nomograms yourself, feel free to share them in the comments below!
1
Spread The Love, Share Our Article
Subscribe to:
Post Comments (Atom)


1 Response to Multiplying with a Parabola!
This one is pretty cool: http://cp4space.wordpress.com/2012/08/29/elliptic-curve-calculator/ - using elliptic curves to do the same things.
Post a Comment