1

Desmos Graphing Calculator

Published on Thursday, November 29, 2012 in , , , ,

Desmos' Wave Interference DemoAs regular readers of Grey Matters know, I love free online mathematical tools, such as Wolfram|Alpha and instacalc.

There's a new one to add to the mix; it's an online graphing calculator called Desmos. Once you grasp the basics, it's very fun and easy to use.

Below is the introductory video to Desmos made last year:


Much like Wolfram|Alpha, Desmos keeps updating and improving. This second video gives you an idea of the new look and added features you'll see at this writing:


Desmos has made it easy to learn to use, with the help of a 9-page PDF manual, a FAQ section, and a wide variety of videos, including some great How-To videos.

To see some of Desmos' features, let's start with a simple static plot. Here's a function that plots a heart shape. Click on or touch the options button in the upper right, and try clicking the Projector Mode button on and off. If you find your plots are too faint to print or show up on a projected screen, you can use this to make the lines thicker and more visible. Click or touch the options button once again to hide the options menu.

For comparison, here's the same heart-shaped function as plotted in Wolfram|Alpha. Note that Wolfram|Alpha, being made for more advanced calculations, also plots the imaginary part of the graph. Since we just want the real part, we can modify it with the Re[] command. From the lines going off from each side of the heart shape, you can see that Wolfram|Alpha's version is slightly more precise, as well.

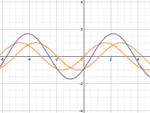
For an even more startling comparison, however, let's try plotting some sine waves. Sine wave #1 will simply be the basic formula, y=sin(x). Sine wave #2 will be the same size and shape, just moved over by a units on the grid, so the formula is simply y=sin(x + a). The third and final sine wave will consist of these two sine wave added together, much like when two water waves meet and boost each each other or cancel each other out, so the formula would simply be y=sin(x)+sin(x+a).

For an example, we'll start with a=-1.17, so the second sine wave will be the same size and shape as the first, but it will be moved to the left (denoted by the minus) by 1.17 units on the grid.

If we try this example with Wolfram|Alpha, here's the results you get. If you want to change a, you could either manually change the -1.17 values in the two formulas and recalculate. Trying this with several different values can get tedious, however. Alternatively, you could pay for Wolfram|Alpha PRO, and then use the enable interactivity button.

Now let's try the same setup on Desmos. Here, there's a slider you can change by either dragging it with your mouse, or touching different points along the line on your mobile device. As you change the value of the slider, the wave changes, and you instantly get a visual idea of how the three waves relate to each other! This demo gives you a good idea of the potential power of Desmos.

One of the main reasons I'm so enthusiastic about Desmos is its potential for clarity and understanding of mathematical concepts. The first time I ever really understood sine and cosine was watching Project Mathematics' Sine and Cosine video series, which used a similarly visual approach. Part 1 is below (Part 2 is here and Part 3 is here):


Ever since seeing that 20+ years ago, I always wanted to have a computer program to play around with graphical concepts in the same way that's done in the video, especially if it had the same apparent ease of use. Desmos comes closer to that idea than anything else I've come across. The fact that it's freely available online is icing on the cake!

0

Create Your Own Personal Equation!

Published on Sunday, November 25, 2012 in , , , , ,

XKCD comic #10

“...I don't write jokes in base thirteen.”
-Douglas Adams, after being told that 6 × 9 is 42 in base 13
After glancing at the post title, you're probably wondering what I mean by “your own personal equation.” I'll give you an example I created specifically for grey matters:


No, I don't expect you to do that calculation in your head. Click on that equation to have Wolfram|Alpha do the math for you.

In the area that says Result, click the Hide block form button, then click the More digits button (also under Result) 2 or 3 times.

Surprise! The answer to that math problem is:


How did I develop an equation that results in my blog's name over and over again? How can you create an equation that gives your name or other short phrases?

BASE 36?!?

If you're used to working with just the digits 0 through 9 (base 10), you might be wondering how letters can even show up as the answer to a mathematical equation.

The answer is that we're a base other than base 10. You might be familiar with base 16, also called hexadecimal, in which you count with the letters A through F, like this: 0, 1, 2, 3, 4, 5, 6, 7, 8, 9, A, B, C, D, E, F, 10, 11...and so on.

If this talk of other number bases confuses you, take some time to read BetterExplained.com's Number Systems and Bases post and/or watch WhyU's Decimal, Binary, Octal, & Hexadecimal video. Both of these resources explain other number bases very clearly.

To be able to create a phrase using any letters (or numbers) we want, we'll need a base that uses all 10 digits plus all 26 letters, which is why we use base 36. So, the last step in our equations will always involve converting an answer to base 36.

WORKING BACKWARDS

We'll find the equation we need by working backwards. The first step is to think of a short phrase you want to use. The shorter the phrase, the smaller the resulting division problem will be. The phrase can only contain letters or numbers, with no spaces, punctuation or other characters. For an example, I'll choose the phrase greymatters, since it's my blog's name.

Go to Wolfram|Alpha, and type in a zero, followed by a decimal point, followed by your phrase repeated 2 or 3 times, followed by an underscore (_) and the number 36. Our greymatters example entry appears like this:


That underscore followed by the 36 simply tells Wolfram|Alpha that the number is to be read as base 36. The repeated use of the phrase lets Wolfram|Alpha know that this represents a repeating decimal.

When you have your entry set up like that hit enter, and Wolfram|Alpha will give you the corresponding number in base 10. If you click on the above entry, you'll see results for the example entry.

At this point, Wolfram|Alpha shows 3 “pods” (Wolfram|Alpha's term for those framed boxes) marked Input interpretation, Decimal form, and Other base conversions. All you need to focus on here is the number in the Decimal form pod. In our greymatters example, that number is:


Clicking or touching the number in the Decimal form pod makes Wolfram|Alpha use that as a new input, and it will return a fraction in the Rational approximation pod. Clicking on the decimal number above will give the fraction shown below, which you should recognize from the start of this post (I've added commas for clarity):


At this point, click or touch this fraction (the number in the Rational approximation pod) to use it as input. Click the fraction above to do this now.

All you have to do now is type the phrase in base 36 after the fraction, and then hit Enter. Check your work by clicking the Hide block form button, and then the More digits button 2 or 3 times, both in the Result pod, and making sure your chosen phrase repeats endlessly. Click the button below to see the end result:


Now try creating your own phrase in the same way. Use a friend's name, and send the Wolfram|Alpha link to them (reminding them to click on the Hide block form button, and then the More digits button 2 or 3 times in the Result pod, of course), and they'll wonder how you figured that out!

TIPS

• The repeating of the phrase is very important, because otherwise the result won't necessarily have all the letters you need. If I started from the input 0.greymatters_36 (no repeat), the result I get is 0.grexum2rp5hzjk..._36, and you can see that only the first few letters were retained.

• You don't have to use base 36. Base 36 simply makes sure that every letter A through Z is available. Once you have a phrase, such as markjones, you can note that, in that phrase, the letter S is the furthest letter in the alphabet, and that it's the 19th letter of the alphabet. Add 10 (for the digits 0 through 9) to 19 to get 29, which means you can make the name markjones repeat in base 29 (or any base from there up to base 36). Just make sure you use the same base throughout the process.

• You can precede the repeating portion with a non-repeating portion. In a forum over at reddit in r/math, where I first ran across this technique, reddit user divergentdave used this tip to create this amusing phrase, which Eduard Khil fans will recognize.

Inspired by a different part of pop culture, I created an equation based on an early XKCD comic titled Pi Equals:

XKCD comic #10

The equation for this one is quite long, but it still works. Click the equation below to see the result:


If you're curious, the name of that top number is roughly 1.178 trevigintillion, a 73-digit number, while the bottom number is roughly 388 duovigintillion, 72-digit number!

Having calculated a joke in base 36, I now understand why Douglas Adams doesn't write jokes in base 13.

RELATED

If you enjoyed this unusual way of coding long information with a short equation, you also might enjoy Martin Gardner's story of Dr. Zeta, and his technique for coding an entire encyclopedia with just a single mark on a rod.

The endlessly repeating messages made me think of Futility Closet's Blank Column puzzle, which you may also enjoy.

What creative phrases and uses can you come up with for this amusing and amazing technique? I'd love to hear your ideas in the comments!

0

Happy MaThanksgiving!

Published on Thursday, November 22, 2012 in , ,

Vi Hart's Apple Pi and Pumpkin TauToday in the U.S., it's time for the Thanksgiving feast!

You're not supposed to play with your food at the table, so let's play with your food before we get it to the table! Just to keep things clean, we'll play with it mathematically.

As Thanksgiving is a US holiday, it's just another day of the week in Britain. Brady from Numberphile grabbed some Numberetti, which is alphabet soup with numbers instead of letters, and took the can's challenge to heart:


Coming back across the pond for Thanksgiving, the meals in the U.S. require a little more preparation.

Don't worry, though, Wolfram|Alpha is here to help! In the widget below, put the weight of your turkey in pounds into the widget below, and select whether you're cooking at a standard or high altitude, then click Submit. A pop-up will then tell you exactly how long to cook your turkey!


Wolfram|Alpha also provides other information, including nutrition information, if you go to the site and ask how long to cook a turkey.

If you really want to go all out, however, it's going to be tough to top the efforts of Vi Hart, who has made a complete mathematical Thanksgiving dinner! My personal favorite is the Borromean Onion Rings:


Speaking of dinner, I'd better get back in the kitchen and do my part. To everyone in the U.S., Happy Thanksgiving!

0

Even More Quick Snippets

Published on Sunday, November 18, 2012 in , , , , , , ,

Luc Viatour's plasma lamp pictureNovember's snippets are here!

This time around, we're treating you to a little history, a little controversy, and some eye-opening mathematics. You shouldn't get too lost, as this journey will mostly take place through the magic of video.

• Here's a young man by the name of Ethan Brown, together with his uncle, wrestling commentator Joey Styles. Even as young as Ethan is, he performs an amazing magic square routine using his Uncle's birthday:


Would you like to learn how to do this? This routine, known as the Double Birthday Magic Square, was developed by Dr. Arthur Benjamin, who has made the entire routine available on his website as a free PDF!

• There's a classic challenge known as the Monty Hall paradox/dilemma/problem. I've written about it in 2006, and again in 2010 (among other times). Earlier this month, AsapSCIENCE posted a new video on it that explains it quite well:


If you read my post on Bayes' theorem, you should recognize the equations that were written at about the 2:00 mark in the video.

It turns out Bayes' theorem is an excellent tool for explaining the Monty Hall problem. Using the tree diagram approach from the Bayes' Theorem - Explained Like You're Five video, with help from Wolfram|Alpha and the Syntax Tree Generator, I put together and posted this visual explanation of the Monty Hall problem over at the Magic Cafe. If you've struggled with this paradox before, this explanation may help clear things up.

Bayes' theorem really is powerful. For example, back in 2009, Air France Flight 447 disappeared off the radar and a long search began, not just for the plane and people, but for the reason as well. For 2 years, they searched for the airplane's flight recorder without luck, until they hired a team to use Bayes' theorem to narrow down a search area. After that, the flight recorders were recovered very quickly!

Even as powerful as Bayes' theorem is, it had a reputation as being bad mathematics through much of the 20th century. It's only recently that it's gained a wider respect. Sharon Bertsch McGrayne wrote a book on this history, called The Theory That Would Not Die: How Bayes' Rule Cracked the Enigma Code, Hunted Down Russian Submarines, and Emerged Triumphant from Two Centuries of Controversy. She talks about the controversy in the following 32-minute lecture at Singularity Summit 2011:


There's also a 55-minute video of her Google talk available. If you're curious about her mentions of Alan Turing and the Enigma machine, I have a post from July all about Alan Turing.

Numberphile has posted a number of good, enjoyable videos recently. Being interested in the Tau vs Pi fight (and let's not forget Eta), I enjoyed their Tau replaces Pi video:


Take the time to check the rest of their other recent videos out, as well. The explanations are always fun.

0

Aha! An Insight Outlook

Published on Thursday, November 15, 2012 in , , , ,

CrazyPhunk's puzzle photoRegular Grey Matters readers realize that I'm not just a fan of learning about new concepts and ideas, but also of finding clearer and better ways to communicate those concepts and ideas to others.

When you get that aha! moment where you truly understand a concept, or at least start to do so, there's a wonderful feeling of getting past the frustration. In today's post, we'll look at some places that encourage that moment by teaching various concepts clearly and simply.

One of the topics people have a tough time with is physics, the study of matter and how it moves through time and space. The MinutePhysics YouTube channel does a wonderful job of giving an overview of even seemingly difficult physics concepts. For example, this video explains how Einstein deduced the existence, and even the size, of atoms:


For a wider variety of topics, there's CGP Grey's YouTube channel. CGP Grey has a knack for picking topics that make you say, “I've often wondered about that, but never took the time to find out!” For example, as I write this, it's a leap year, so what exactly is the deal with leap years?


Although it's not a YouTube channel per se, the various videos of the “Charlievision” sequences from the show Numb3rs are a wonderful way of explaining complex mathematical concepts. Here's how Numb3rs summed up what is known as the knapsack problem:


Video isn't the only way to grasp new concepts, of course. I've referred to BetterExplained.com numerous times, in praise of their way of presenting insights. At the beginning of A Visual, Intuitive Guide to Imaginary Numbers, the author explains some of his secrets, which focus on analogies, relationships, and visual diagrams whenever possible.

One part of BetterExplained.com you may not be as familiar with, however, is their aha! moment section, where you can share with others the insights that worked for you. As the video below explains, it's a sort of Twitter meets Wikipedia (Twittipedia?):


One of my favorite posts there shares a handy insight from purplemath.com for remembering how to determine the proper sign when multiplying with negative numbers:

good things (+) happening to good people (+): a good thing (+)
good things (+) happening to bad people (-): a bad thing
bad things (-) happening to good people (+): a bad thing
bad things (-) happening to bad people (-): a good thing (+)
The final site in this post is a fascinating corner of reddit, called Explain Like I'm Five. There, you can post questions, and others will try and explain the concept to you as clearly and simply as possible. If you know an answer to a posted question, and can answer it in a clear and simple manner, you can post a reply yourself.

They also try and preserve the best answers given in the past, in a post they call The Five-Year-Old's Guide to the Galaxy. You'll find it's not hard to lose a lot of time finding simple answers to things you've probably wondered about frequently.

These sites may not go into every last detail needed to master the understanding of a concept, but that's OK. The general gist of all of them is to help you grasp the basics, and give you a strong foundation from which to explore each idea further.

If you have any sites where you regularly find clear and helpful insights, please share them with us in the comments!

0

Bayes' Theorem

Published on Sunday, November 11, 2012 in , , , ,

mattbuck's Bayes' Theorem neon sign photoEver wonder what happens to those amazing breakthroughs you hear about on the news, but never hear about again? Somehow, when they're finally released, the amazing qualities of, say, that new wonder drug, never seem to reduce the suffering the way most people hoped.

Look through the reports on the test results of those breakthroughs, and you'll frequently find one line that says p < 0.05. In other words, the tests indicate that the results reported on in the report had only a 5% chance of happening randomly.

If I flip a coin 20 times, and heads shows up 15 or more times (in other words, greater than 14 times), we can work out that there is roughly a 2.07% chance of that happening at random. Reporting on this, we'd note that p < 0.05, and use this to justify examining whether the coin is really fair.

That works great for events dealing with pure randomness, such as coins, but how do you update the probabilities for non-random factors? In other words, how do you take new knowledge into account as you go? This is where Bayes' theorem comes in. It's named after Thomas Bayes, who developed it in the mid-1700s, but the basic idea has been around for some time.

You should be familiar, of course, with the basic formula for determining the probability of a targeted outcome:


The following video describes the process of Bayes' theorem without going into any more mathematics than the above formula, using the example of an e-mail spam filter:


To get into the mathematical theorem itself, it's important to understand a few things. First, Bayes' theorem pays close attention to the differences between the event (an e-mail actually being spam or not, in the above video) and the test for that event (whether a given e-mail passes the spam test or not). It doesn't assume that the test is 100% reliable for the event.

BetterExplained.com's post An Intuitive (and Short) Explanation of Bayes’ Theorem takes you from this premise and a similar example, all the way up to the formula for Bayes' theorem. It's interesting to note that it's effectively the same as the classic probability formula above, but modified to account for new knowledge.

The following video uses another example, and is also simple to follow, but delves into the math as well as the process. Understanding the process first, and then seeing how the math falls into place helps make it clear:


The tree structure used in this video helps dramatize one clear point. Bayes' theorem allows you to see a particular result, and make an educated guess as to what chain of events led to that result.

The p < 0.05 approach simply says “We're at least 95% certain that these results didn't happen randomly.” The Bayes' theorem approach, on the other hand, says “Given these results, here are the possible causes in order of their likelihood.”

If I shuffle a standard 52-card deck, probability tells us that the odds of the top card being an Ace of Spades is 1/52. If I turn up the top card and show you that it's actually the 4 of Clubs, our knowledge not only chance the odds of the top card being the Ace of Spades to 0/52, but gives us enough certain data we can switch to employing logic. Having seen the 4 of Clubs on top and knowing that all the cards in the deck are different, I can logically conclude that the 26th card in the deck is NOT the 4 of Clubs.

We can switch from probability to logic in this manner because we've gone from randomness to certainty. What if I don't introduce certainty, however? What if I look at the top card without showing it to you, and only state that it's an Ace?

This is the strength of Bayes' theorem. It bridges the ground between probability with logic, by allowing you to update probabilities based on your current state of knowledge, not just randomness. That's really the most important point about Bayes' theorem.

There's much more to Bayes' theorem than I could convey in a short blog post. If you're interested in a more in-depth look, I suggest the YouTube video series Bayes' Theorem for Everyone. I think you'll find it surprisingly fascinating.

4

My 2 Cards? What Are The Odds?

Published on Thursday, November 08, 2012 in , , , ,

Scam School logoWe're going to jump all the way back to 2009, to the 60th episode of Scam School (At this writing, that was 183 episodes ago).

In that episode, host Brian Brushwood presented a scam whose odds sounded almost too good to be true. I'll investigate the actual odds in this post.

In episode 60 of Scam School, there are 2 scams that are taught. This post focuses on the “Playing The Odds” scam which starts at the 4:33 mark in the following video:


What are the chances of two named values being together in a deck of cards? Brian mentions his experience of the probabilities in his write-up:

Amazingly (and to just about everyone's disbelief), it seems that about 70% of the time, any two named values will just happen to be side by side in a shuffled deck of cards!

(by the way, math wizards: if you can figure out a way to calculate the exact odds on this, I'm all ears. After hours of playing with the numbers, I finally gave up and just did a brute force calculation: after 50 trials, I ended up averaging about a 70% success rate)
It's not easy to develop probability equations for this challenge. Just defining all the possible arrangements involved is a challenges. I don't doubt that this is why Brian gave up playing with the numbers, and turned to brute force calculations, otherwise known as the Monte Carlo method.

James Grime filmed a response video in which he explains the difficulty of calculating the odds via equations, and the result of his own Monte Carlo simulations:


The video shows a probability of 48.3%, and the information box in the video says that other experiments moved that closer to 48.6%.

After watching this video, I wrote and ran my own Monte Carlo simulations in jQuery. I had the computer mix the deck using this implementation of the modern Fisher–Yates shuffling algorithm, which a quick pencil-and-paper exercise will make clear.

After running 10 million trials of my own simulation, my results suggested a 48.63627% chance of succeeding, effectively the same 48.6% chance described above. In short, the person betting against the 2 values showing up next to each other will win roughly 51.4% of the time. With such a low probability of success, how did this bet manage to become popular?

The first thought I had about this was that perhaps it involved paying less than true odds. The odds of you winning this bet are roughly 1.056 to 1 against. In other words, as long as you can convince someone to bet at least $1.06 to every $1 you bet, you could still make money with this bet over the long term. That doesn't seem very likely.

Many bets hinge on a little wordplay. For example, there's a classic bet where you claim you can name the day someone was born, with an accuracy of plus or minus 3 days. Once they put up their money, you simply say “Wednesday,“ and take their money. Since every day of the week is plus or minus 3 days from Wednesday, you can't lose.

In a similar manner, perhaps we can use wordplay to give us a better margin of error for this bet. What if, instead of mentioning that the cards must be next to each other, the bet was that the two values would be within 1 card of each other? If the two cards show up right next to each other, as in the original bet, this sounds exactly like what you bet. In addition, it also covers the possibility of the 2 values showing up with 1 card between them.

I re-programmed my simulation to include the new possibilities, ran it another 10 million times, and came up with about a 73.6% chance of success, or odds of roughly 2.8 to 1 in favor of winning!

Brian's own test trials intrigue me. Assuming that he wound up winning 34 out of those 50 times, which seems reasonable given the “about 70%” phrasing, Wolfram|Alpha says there's only about a 0.44% chance, or odds of about 224 to 1 against winning 34 or more out of 50 such trials! As with any trials, though, long shots can and do happen.

Alternatively, that claim might be a scam...

0

A Puzzle with its Ups and Downs

Published on Sunday, November 04, 2012 in , , , , , ,

Konrad Jacobs' photo of Martin GarnderMartin Gardner made many puzzles and magic tricks popular over the years.

This post focuses on one particular bar bet whose popularity seems to come and go like the tide. It involves nothing more than 3 glasses and someone to challenge.

Martin Gardner first wrote up this puzzle in his December 1963 Scientific American column. It was later reprinted in the “Parity Checks” chapter of Martin Gardner's 6th Book of Mathematical Diversions from Scientific American.

A brief write-up of it is also found in his book Entertaining Science Experiments with Everyday Objects under the name “Topsy-Turvy Tumblers,” and Google Books has made the Topsy-Turvy Tumblers page available online for free.

Usually, it's described with the objective as getting all 3 cups mouth up, but it's easy enough to alter the goal to getting all 3 cups mouth down, as in the following video:


Whether you decide your challenge will be to get all the cups face-up or face-down, the process is the same. The spectator must follow your action exactly, do everything in 3 moves, and wind up with the cups facing the same way as you.

The three moves are a throw-off. When you look at the alternating set-up at the beginning, it's easy to see that you could achieve the goal by just flipping the two outer cups. Once you realize this, it becomes an easy way to check that you have the cups set in the right position for the correct goal when you do it, and in the wrong position for the wrong goal when the other person does it.

The pattern of moves they have to follow is easy enough. Turn the two rightmost cups, followed by the two outer cups, followed by the two rightmost cups again. When performing this, you really only need to think of this as right-outer-right.

Most people who do this puzzle stop with this once they win their money or drink. There is, however, a little-known sequel to this puzzle. Martin Gardner and Karl Fulves developed it together, but taught it with pennies instead of cups, so few have made the connection between the two routines.

In the sequel, you bet that you can get all 3 glasses facing the same way while blindfolded, and without even knowing the arrangement of the glasses!

You explain that you are going to be blindfolded, or otherwise prevented from seeing and touching the cups (this could be done over the phone, if desired). You mention that since you'll be blindfolded, you need a little leeway and will instruct the other person to flip the glasses one at a time.

The original write-up is a little hard to find, but thankfully, it was printed up in the American Scientist article, “Puzzles and tricks from Martin Gardner inspire math and science,” which is available for free online. It was also discussed further in the January 2012 issue of the College Mathematics Journal, which is also available in full online, in an article by Ian Stewart titled, “Cups and Downs.”

How is this possible? The method is simply this: First, you tell them to flip the leftmost glass. Next, you tell them to flip the middle glass. At this point, you ask them whether all the glasses are facing the same way yet. If so, you stop, of course, and if not, ask them to flip the leftmost glass one more time. At this point, the glasses are guaranteed to all be facing the same way!

After the second flip, the step where you flip the middle glass, you may get lucky and hear audible gasps, indicating that the people are amazed you reached your goal so quickly without looking.

If you don't hear any reactions after the second flip, you'll need to ask a question without appearing to do so. The most effective way to do this is simply to ask, "The cups aren't all facing the same way, are they?" Note that this starts with a negative statement, and then asks the question briefly.

If they reply that the cups are NOT facing the same way, you simply say, “I didn't think so,” and then make the last flip. This way, it sounds to the audience like you knew that wasn't the case all along.

If they reply that the cups ARE all facing the same way now, you say, “I thought so! Thank you!” When it happens this way, it simply seems like you're confirming your success, and knew your challenge was complete!

The Ian Stewart article linked above explains the mathematics behind this in a very clear manner, largely with a simple diagram of a cube. The American Scientist article also features a 4-object flipping sequence in which 2 objects are flipped at a time, and it still takes 3 moves or less without looking.

Play around with this bet, and better yet, take the time to examine the mathematics behind it. For such a seemingly simple bit of business, it has plenty to teach.

0

Understanding Math with Wolfram|Alpha

Published on Thursday, November 01, 2012 in , , , ,

1958 USPS postage stamp honoring Paul Revere superimposed on Mangan2002's photo of a basketball displayIn the past, I've discussed standard ways of visualizing mathematical concepts, including ways to grasp pi and get a sense of scale. What if you need to create your own visualizations, however?

It turns out our old friend Wolfram|Alpha is not only good at working out the math, but making it easier to grasp, as well.

Let's say you work for a company that's giving a holiday dinner for all 3,000 of its employees. As part of this dinner, there will be a drawing in which one of the employees will win a new car.

Your probability of winning the car, of course, is 1 in 3,000, and you really want to understand what this probability means. So, you might try working out 1/3,000 on Wolfram|Alpha, and seeing that this is equivalent to 0.03333%. All that really happened here is that you now have a different number to ponder. We know that a probability of 1 in 3,000 and 0.03333% is a slim chance, but it's all still too abstract.

As explained in the book Made To Stick, the trick to taking something abstract and making it concrete is to describe it in a way that can be experienced through the senses. My blog post on concreteness as it applies to magic performances goes into more detail, as well.

Instead of simply seeing the numbers as chances, then, what if we imagined the 3,000 represented some kind of physical space? For example, 3,000 might be pictured as 3,000 miles. What does 3,000 miles look like? Entering 3,000 miles in Wolfram|Alpha, we find out that this distance is about ¾ the length of the Amazon river, 20% longer than the distance from New York to Los Angeles, or about ⅛ the circumference of the earth at the equator.

It's getting easier to picture, but still a little hard to grasp. Let's try scaling things down to inches and see what happens. 3,000 inches is 10% longer than a Boeing 747, or the height of a 28-story building. That's good, but perhaps picturing it as an area, in square inches would be better.

Trying out 3,000 square inches, we see that this is roughly the size of the surface area of 11 NBA basketballs! This is a great image, as it's well within the realm of the average person's experience.

Remember, though, that we're trying to picture what 1 in 3,000 looks like, so we need to picture 1 square inch, as well. Wolfram|Alpha says that 1 square inch is about the size of a postage stamp, which is another great image.

Putting this together, we see that 1 in 3,000 can be pictured as the area of a postage stamp as compared to the surface area of 11 NBA basketballs! The image below gets the concept across quickly and directly.

1958 USPS postage stamp honoring Paul Revere superimposed on Mangan2002's photo of a basketball display

Now that you can see the drawing as 11 basketballs covered in stamps, with a hope of the company picking your single stamp out of those, it's more easily understood.

It's best to play around with different ways of seeing the numbers involved to find the best image. Switching to metric, we see that 1 cm and 3,000 cm gives the image of the width of a CD case as compared to the length of the average blue whale. There's also the volume of volume of 26 M&MS as compared to 950 large eggs.

There's nothing that says you have to use physical space, either. 1 in 3,000 could just as easily be thought of as a single second out of an average college lecture, the mass of a ¾-full can of soda as compared to the that of 2 dairy cows, and more!

Note that, while discovering the images requires particular units of measurement, presenting the images doesn't require disclosing units at all. Stamps, basketballs, CD cases and blue whales become the units themselves. When exploring various images, you'll find that larger numbers generally require smaller units.

Play around with numbers you use, and see what you discover. If you find any numbers you've been able to make visual with amazing or amusing images, I'd love to hear about them in the comments!